
3. Quality control of RNA-seq reads
Last updated on 2026-11-10 | Edit this page
Overview
Questions
- How do we check the quality of raw RNA-seq reads?
- What information do FastQC and MultiQC provide?
- How do we decide if trimming is required?
- What QC issues are common in Illumina RNA-seq data?
Objectives
- Run FastQC and MultiQC on RNA-seq FASTQ files.
- Understand how to interpret the important FastQC modules.
- Learn which FastQC warnings are expected for RNA-seq.
- Understand why trimming is usually unnecessary for standard RNA-seq.
- Identify samples that may require closer inspection.
Introduction
Before mapping reads to a genome, it is important to evaluate the
quality of the raw RNA-seq data.
Quality control helps reveal problems such as adapter contamination, low
quality cycles, and unexpected technical issues.
In this episode, we will run FastQC and MultiQC on the p53/ionizing
radiation dataset and interpret the results.
We will also explain when trimming is useful and when it can be harmful
for alignment based RNA-seq workflows.
FastQC evaluates individual FASTQ files. MultiQC summarizes all FastQC reports into one view, which is helpful for comparing replicates.
Why do we perform QC on FASTQ files?
Quality control answers several questions:
- Are sequencing qualities stable across cycles?
- Are adapters present at high levels?
- Do different replicates show similar patterns?
- Are there outliers that indicate failed libraries?
QC provides confidence that downstream steps will be reliable.
Running FastQC
FastQC generates an HTML report for each FASTQ file. For paired-end datasets, you can run it on both R1 and R2 together or separately.
We will create a directory for QC output and then run FastQC on all FASTQ files.
Run FastQC on your FASTQ files
Use the commands below to run FastQC on all reads in the
data directory.
BASH
cd $SCRATCH/rnaseq-workshop
mkdir -p results/qc_fastq/

sinteractive -A rcac-rnaseq -q standby -p cpu -N 1 -n 4 --time=1:00:00
module load biocontainers
module load fastqc

fastqc data/*.fastq.gz --outdir results/qc_fastq/ --threads 4
FastQC writes one HTML report and one zip archive per FASTQ file:
WT_Bcell_IR_rep1_R1_fastqc.html
WT_Bcell_IR_rep1_R1_fastqc.zip
WT_Bcell_IR_rep1_R2_fastqc.html
WT_Bcell_IR_rep1_R2_fastqc.zip
WT_Bcell_IR_rep2_R1_fastqc.html
WT_Bcell_IR_rep2_R1_fastqc.zip
WT_Bcell_IR_rep2_R2_fastqc.html
WT_Bcell_IR_rep2_R2_fastqc.zip
WT_Bcell_IR_rep3_R1_fastqc.html
WT_Bcell_IR_rep3_R1_fastqc.zip
WT_Bcell_IR_rep3_R2_fastqc.html
WT_Bcell_IR_rep3_R2_fastqc.zip
WT_Bcell_IR_rep4_R1_fastqc.html
WT_Bcell_IR_rep4_R1_fastqc.zip
WT_Bcell_IR_rep4_R2_fastqc.html
WT_Bcell_IR_rep4_R2_fastqc.zip
WT_Bcell_mock_rep1_R1_fastqc.html
WT_Bcell_mock_rep1_R1_fastqc.zip
WT_Bcell_mock_rep1_R2_fastqc.html
WT_Bcell_mock_rep1_R2_fastqc.zip
WT_Bcell_mock_rep2_R1_fastqc.html
WT_Bcell_mock_rep2_R1_fastqc.zip
WT_Bcell_mock_rep2_R2_fastqc.html
WT_Bcell_mock_rep2_R2_fastqc.zip
WT_Bcell_mock_rep3_R1_fastqc.html
WT_Bcell_mock_rep3_R1_fastqc.zip
WT_Bcell_mock_rep3_R2_fastqc.html
WT_Bcell_mock_rep3_R2_fastqc.zip
WT_Bcell_mock_rep4_R1_fastqc.html
WT_Bcell_mock_rep4_R1_fastqc.zip
WT_Bcell_mock_rep4_R2_fastqc.html
WT_Bcell_mock_rep4_R2_fastqc.zip
Understanding the FastQC report
FastQC produces several diagnostic modules. RNA-seq users often misinterpret certain modules, so we focus on the ones that matter most.
Which FastQC modules are important for RNA-seq?
Most informative modules:
- Per base sequence quality
- Per sequence quality scores
- Per base sequence content
- Per sequence GC content
- Adapter content
- Overrepresented sequences
Modules that commonly show warnings for RNA-seq, even when libraries are fine:
- Per sequence GC content (RNA-seq reflects transcript GC bias, not whole genome)
- K-mer content (poly A tails and priming artifacts often trigger warnings)
Warnings do not always indicate problems. Context and comparison across samples matter more than individual icons.
Key modules explained
Below are guidelines for interpreting the most useful modules.
Each module below shows the plot from your own run of the workshop data (“your output”), followed by a contrast example: a schematic cartoon or a plot from a different dataset that shows what a problem, or a very clean run, looks like. The contrast examples are not from this workshop’s samples.
Per base sequence quality
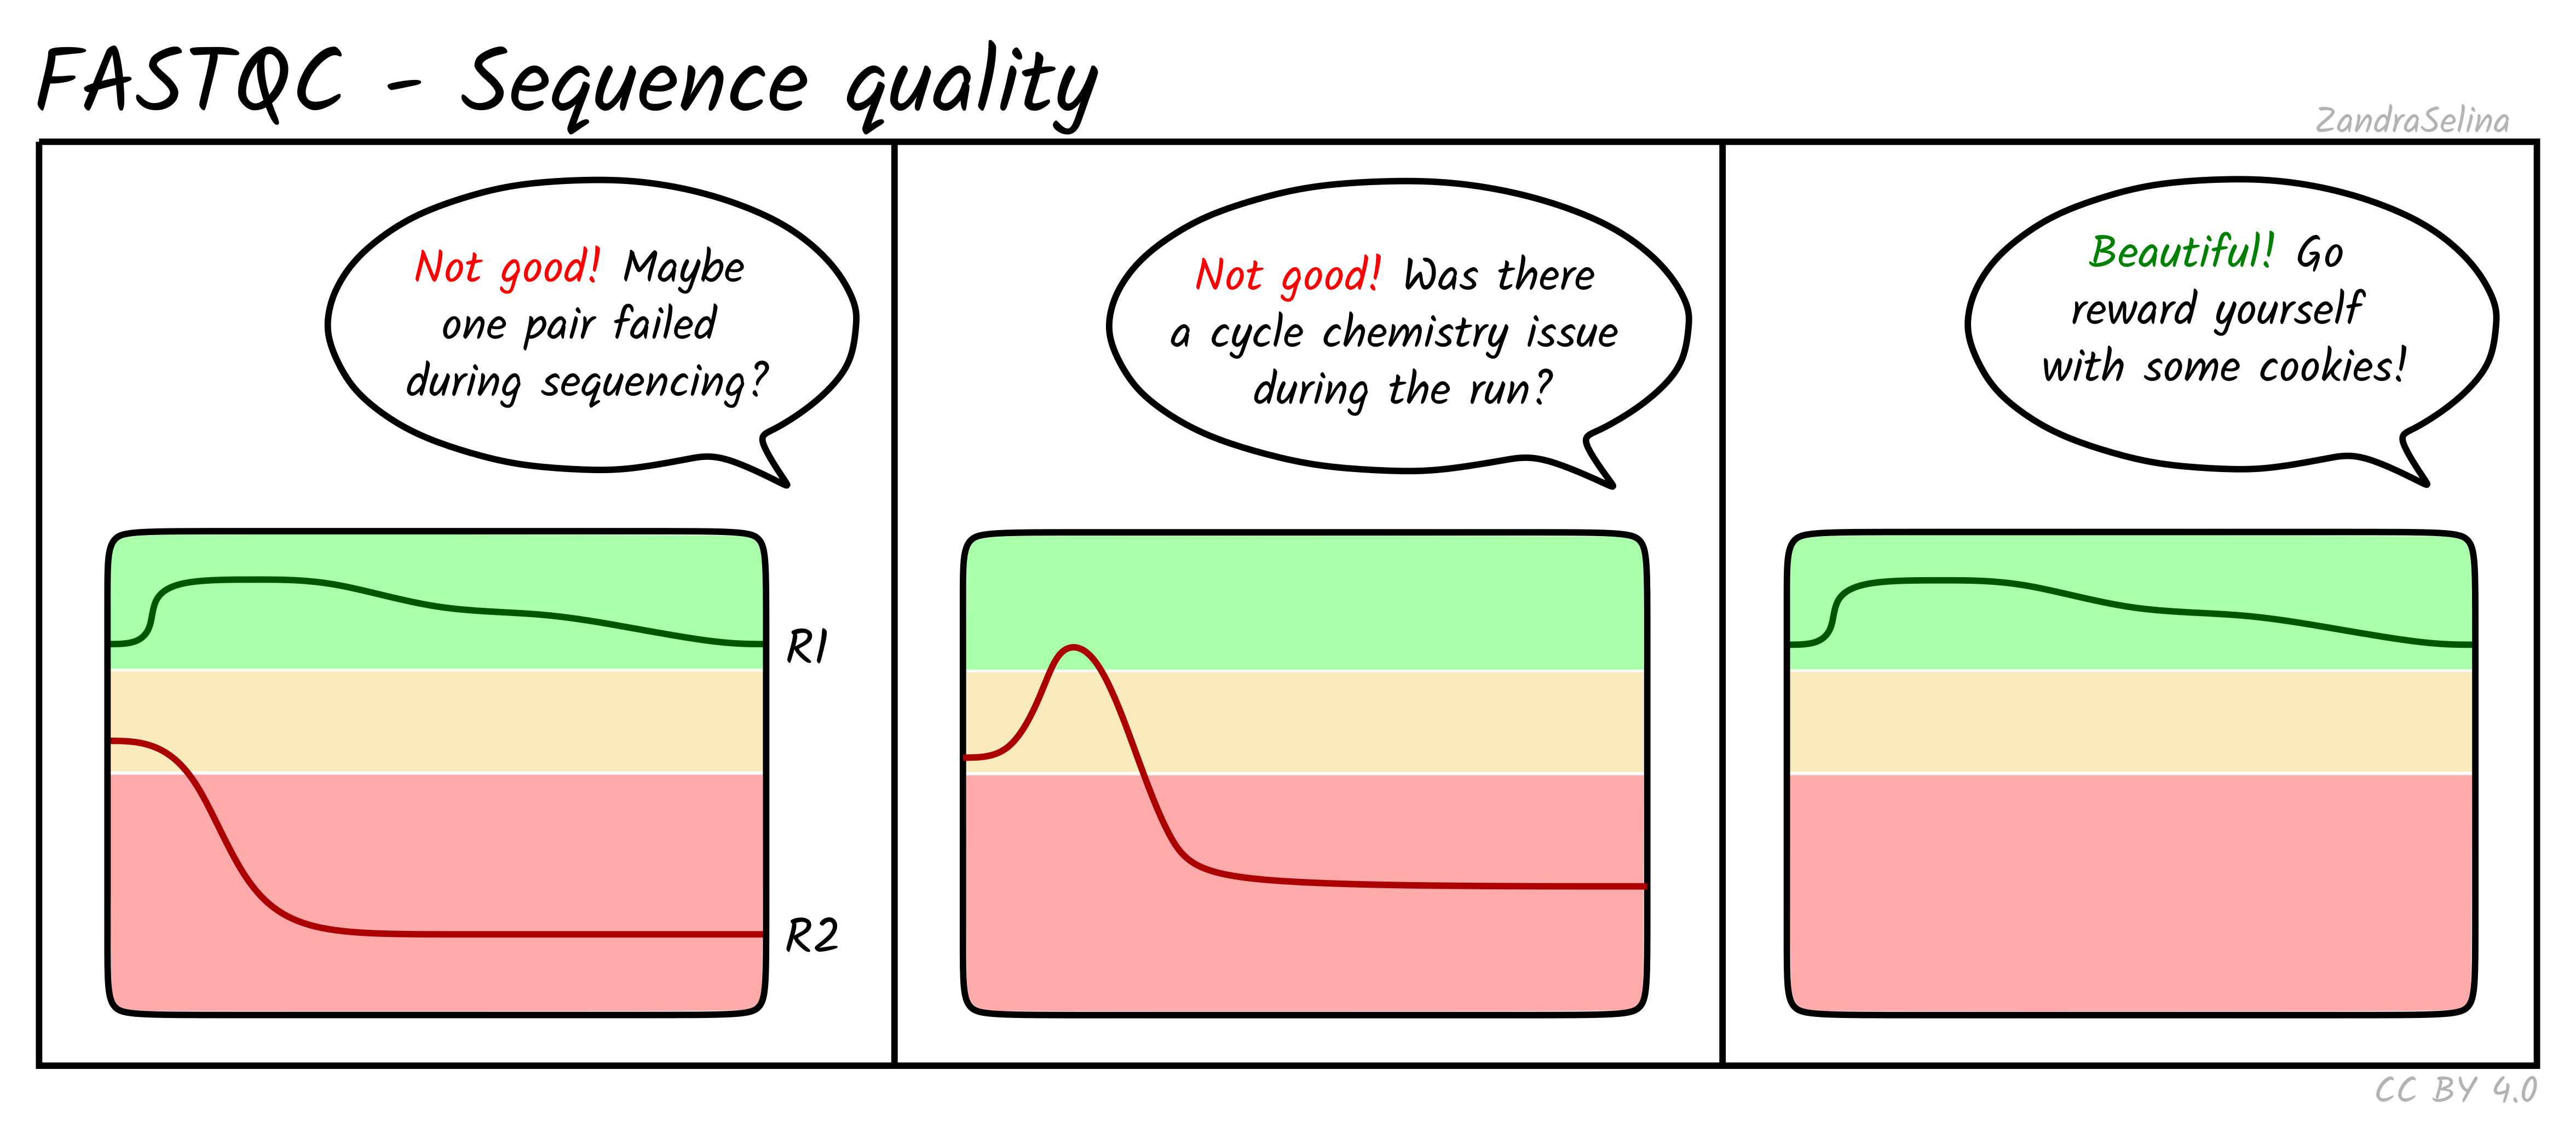
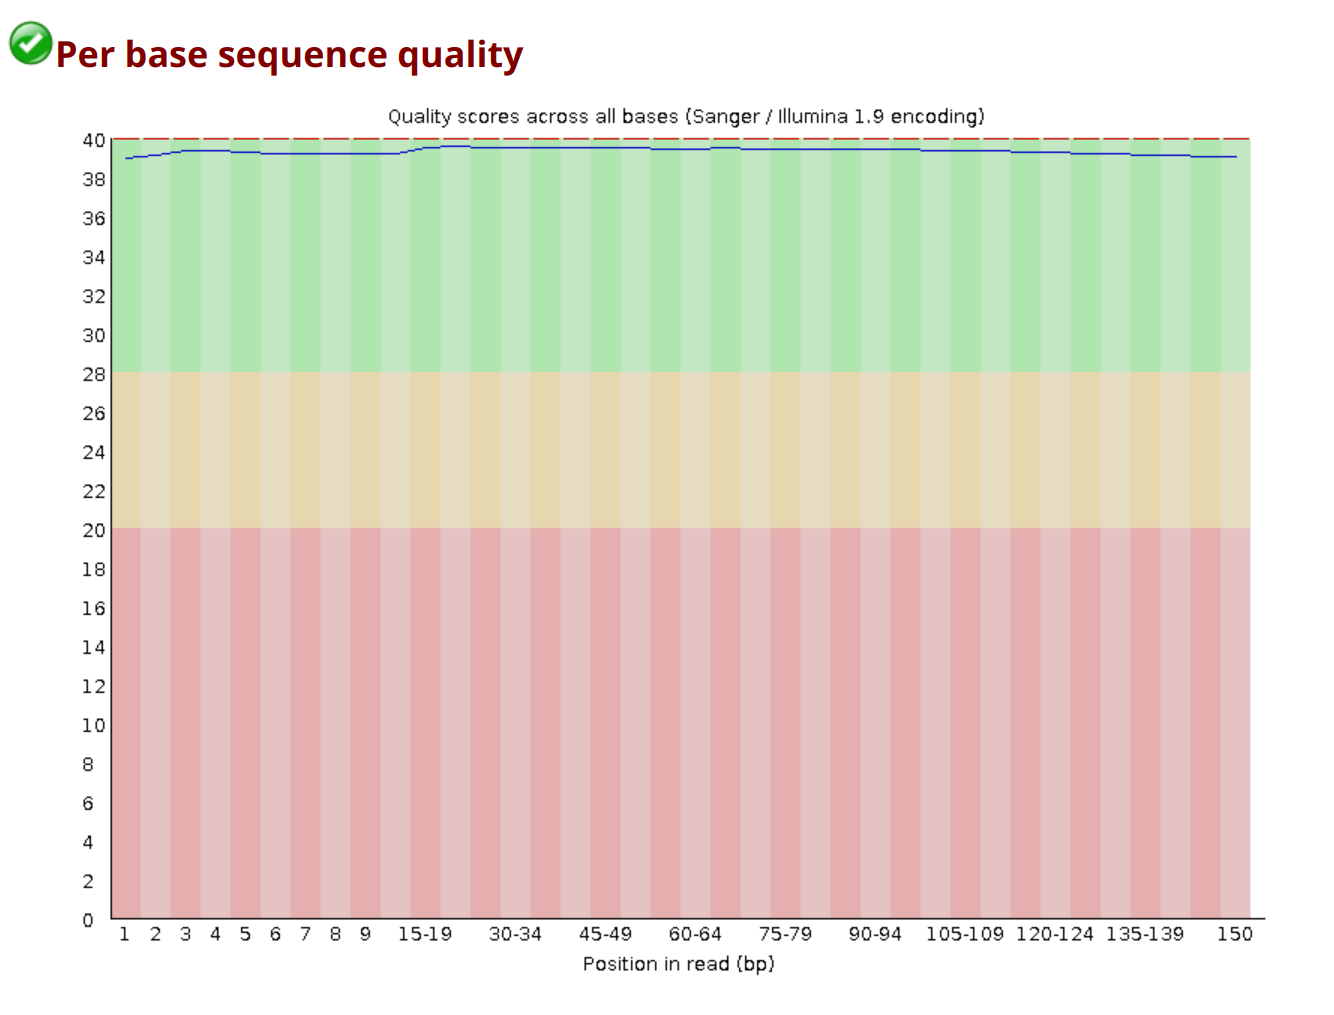
Shows the distribution of quality scores at each position across all reads. You want high and stable quality across the read. A small quality drop at the end of R2 is common and usually not a problem.
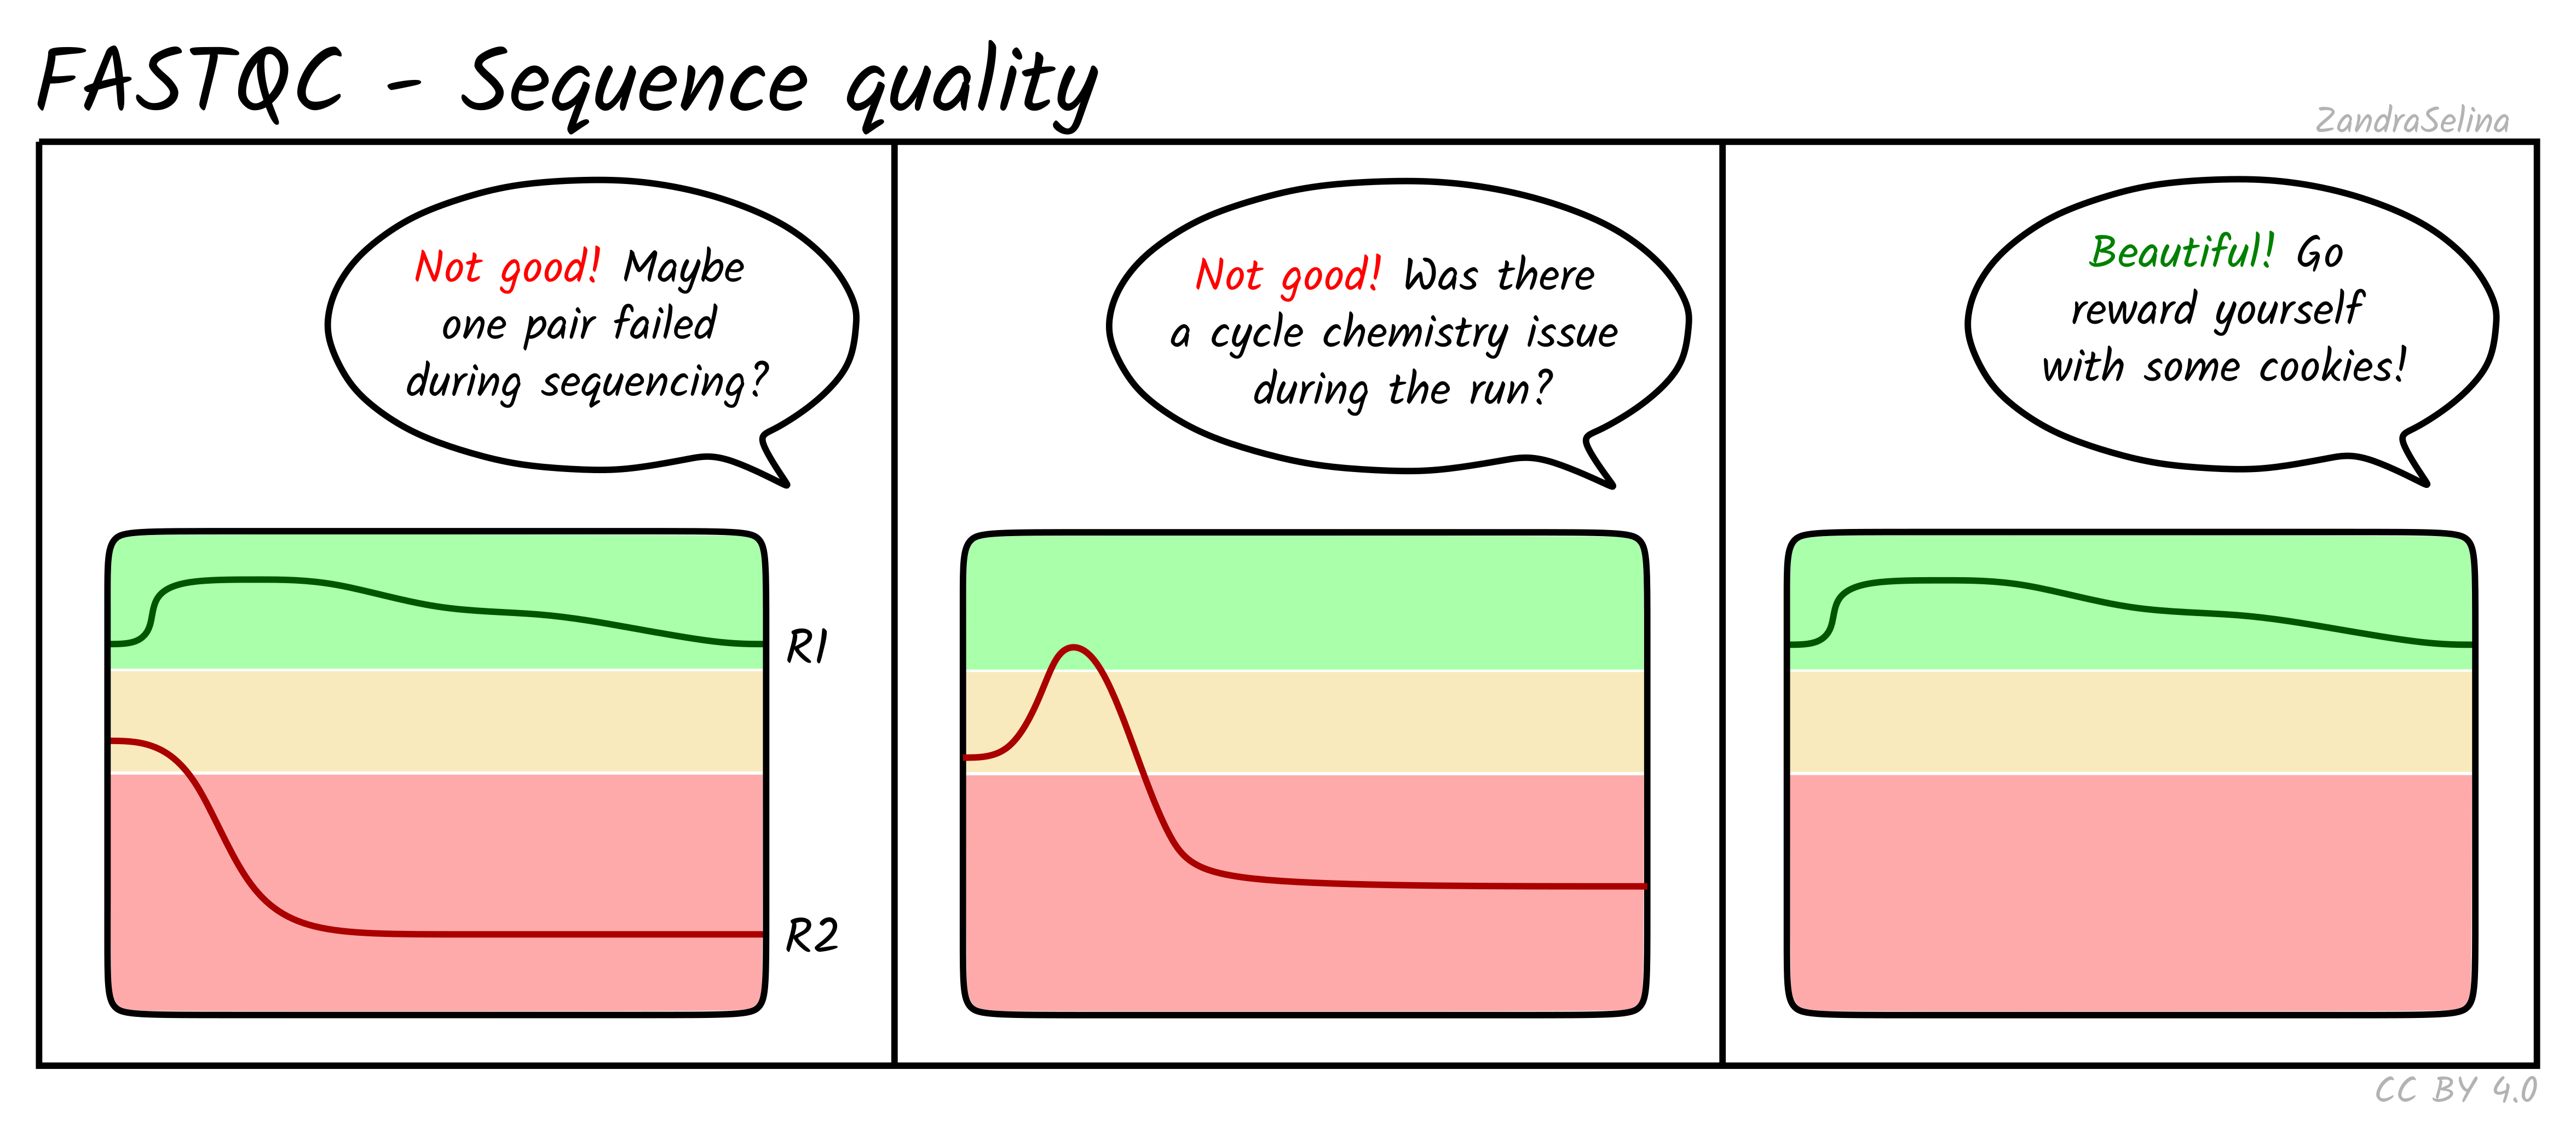
In the workshop data, the ten files from flowcell C1PF5ACXX (IR_rep1, IR_rep2, and mock_rep1 to mock_rep3) sit lower and drop sharply at the last cycle. The six files from the other two flowcells stay high, apart from a dip at cycle 27 in IR_rep4 R2 and a weaker last cycle in mock_rep4 R1.
Per tile sequence quality
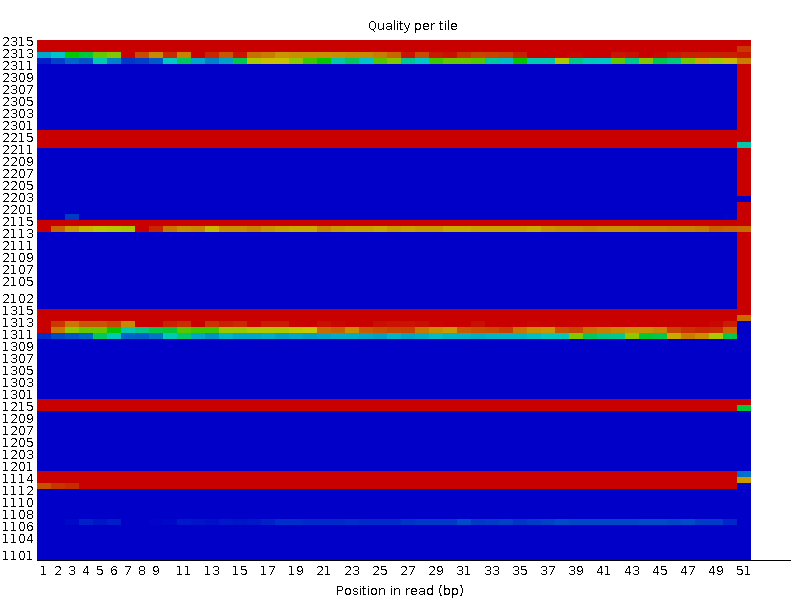
Reports whether specific regions of the flowcell produced lower quality reads. Uneven tiles can indicate instrument issues or bubble formation. In this workshop’s data the module fails in 12 of 16 files: all ten from flowcell C1PF5ACXX, plus IR_rep4 R2 and mock_rep4 R1.
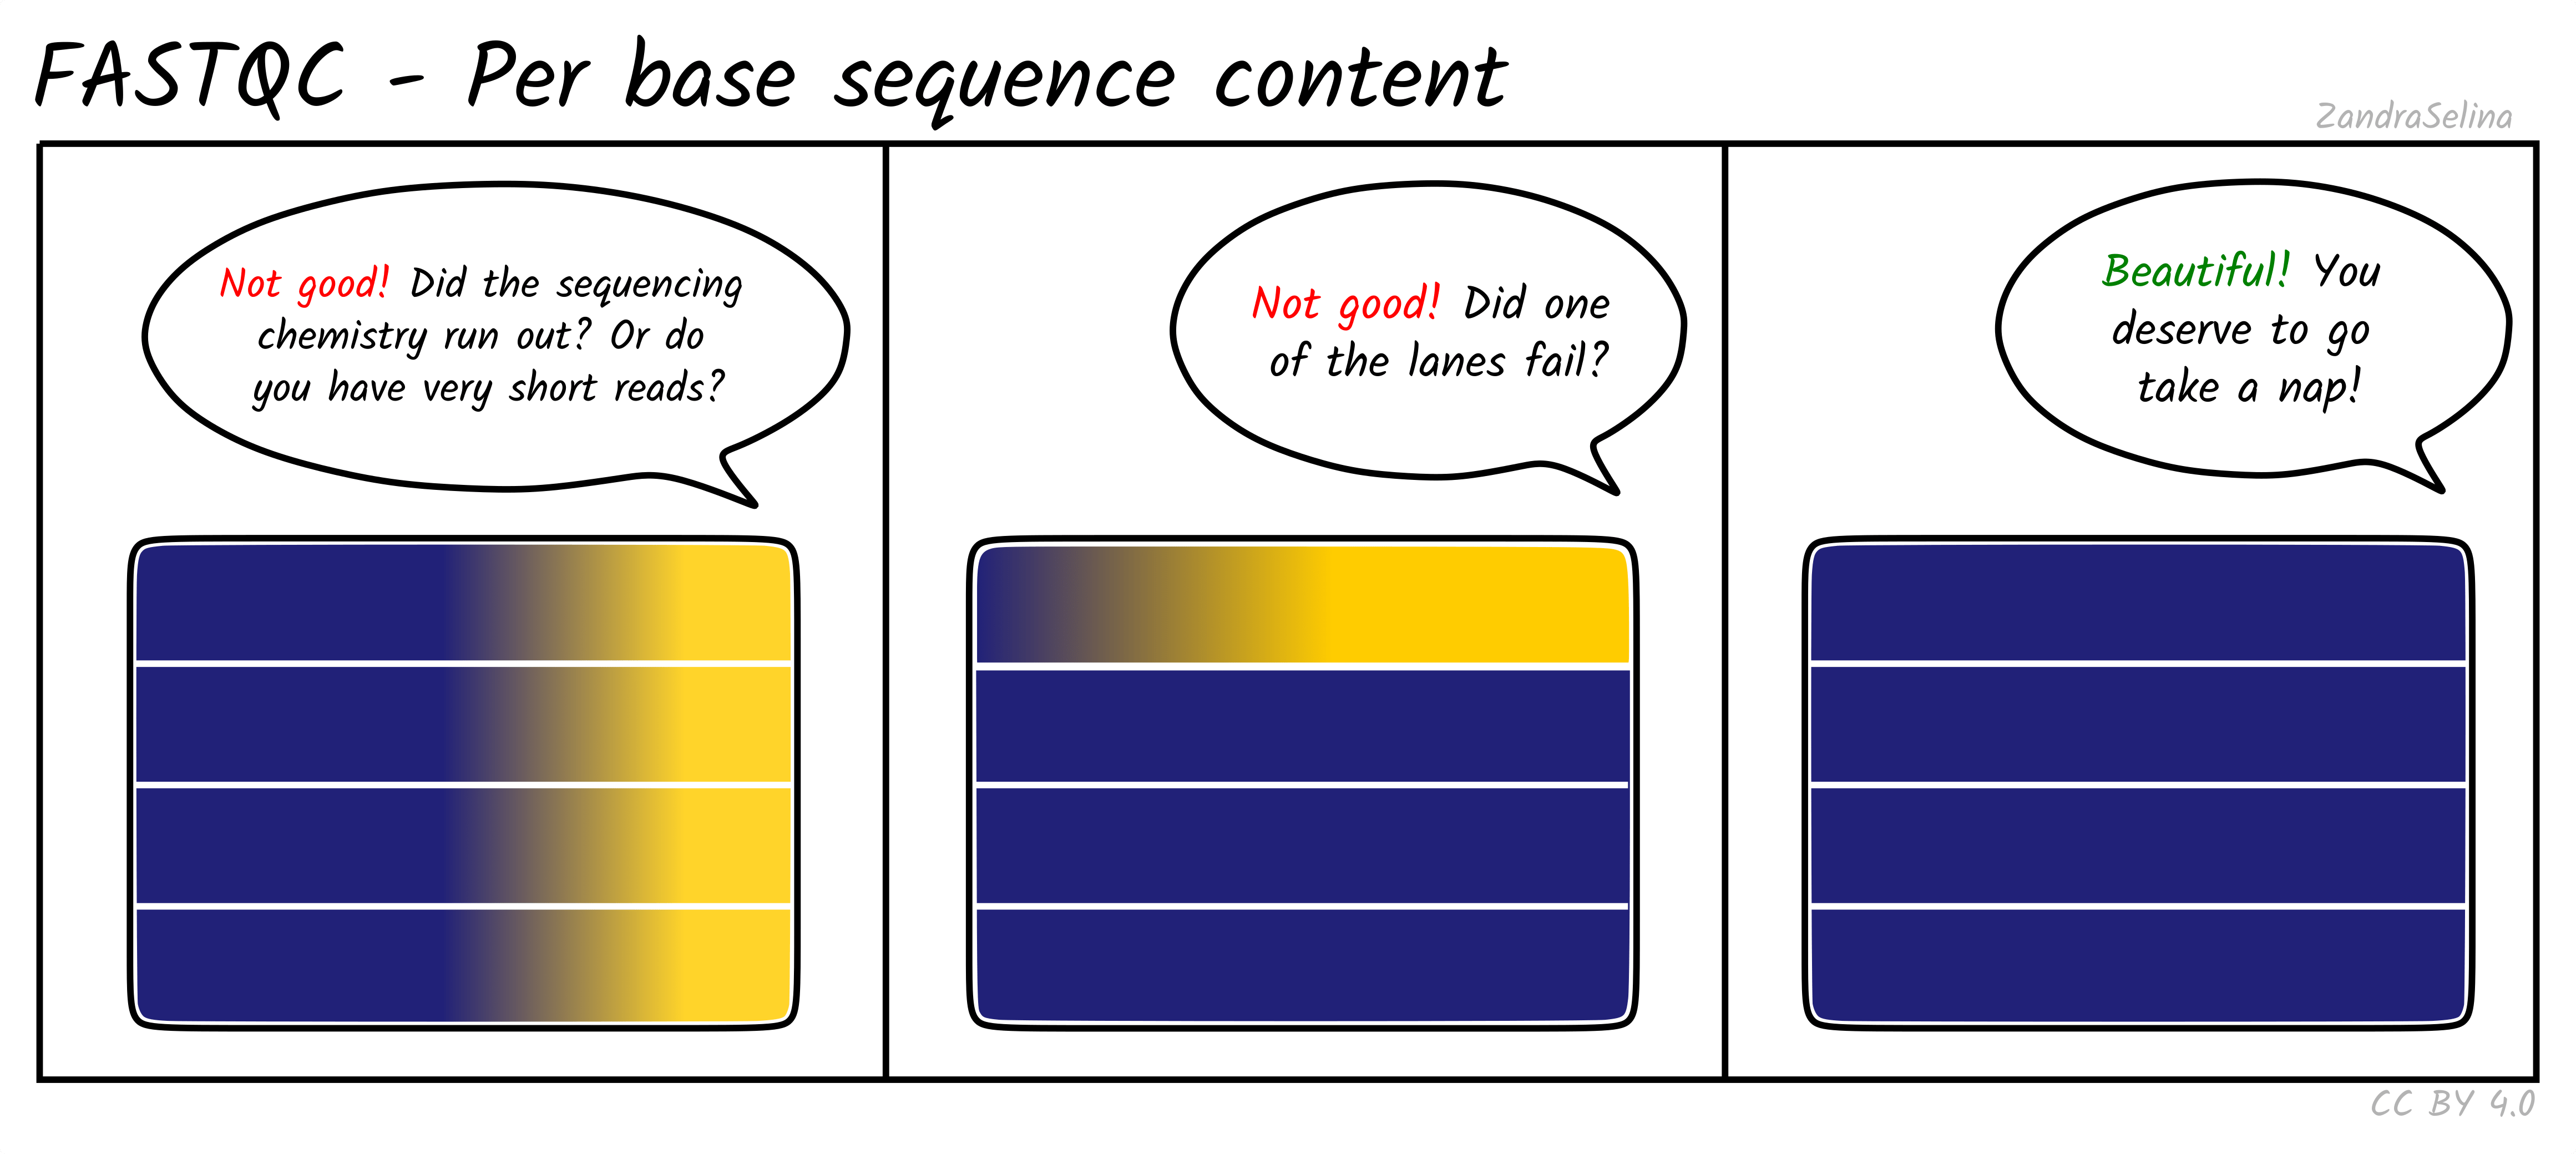
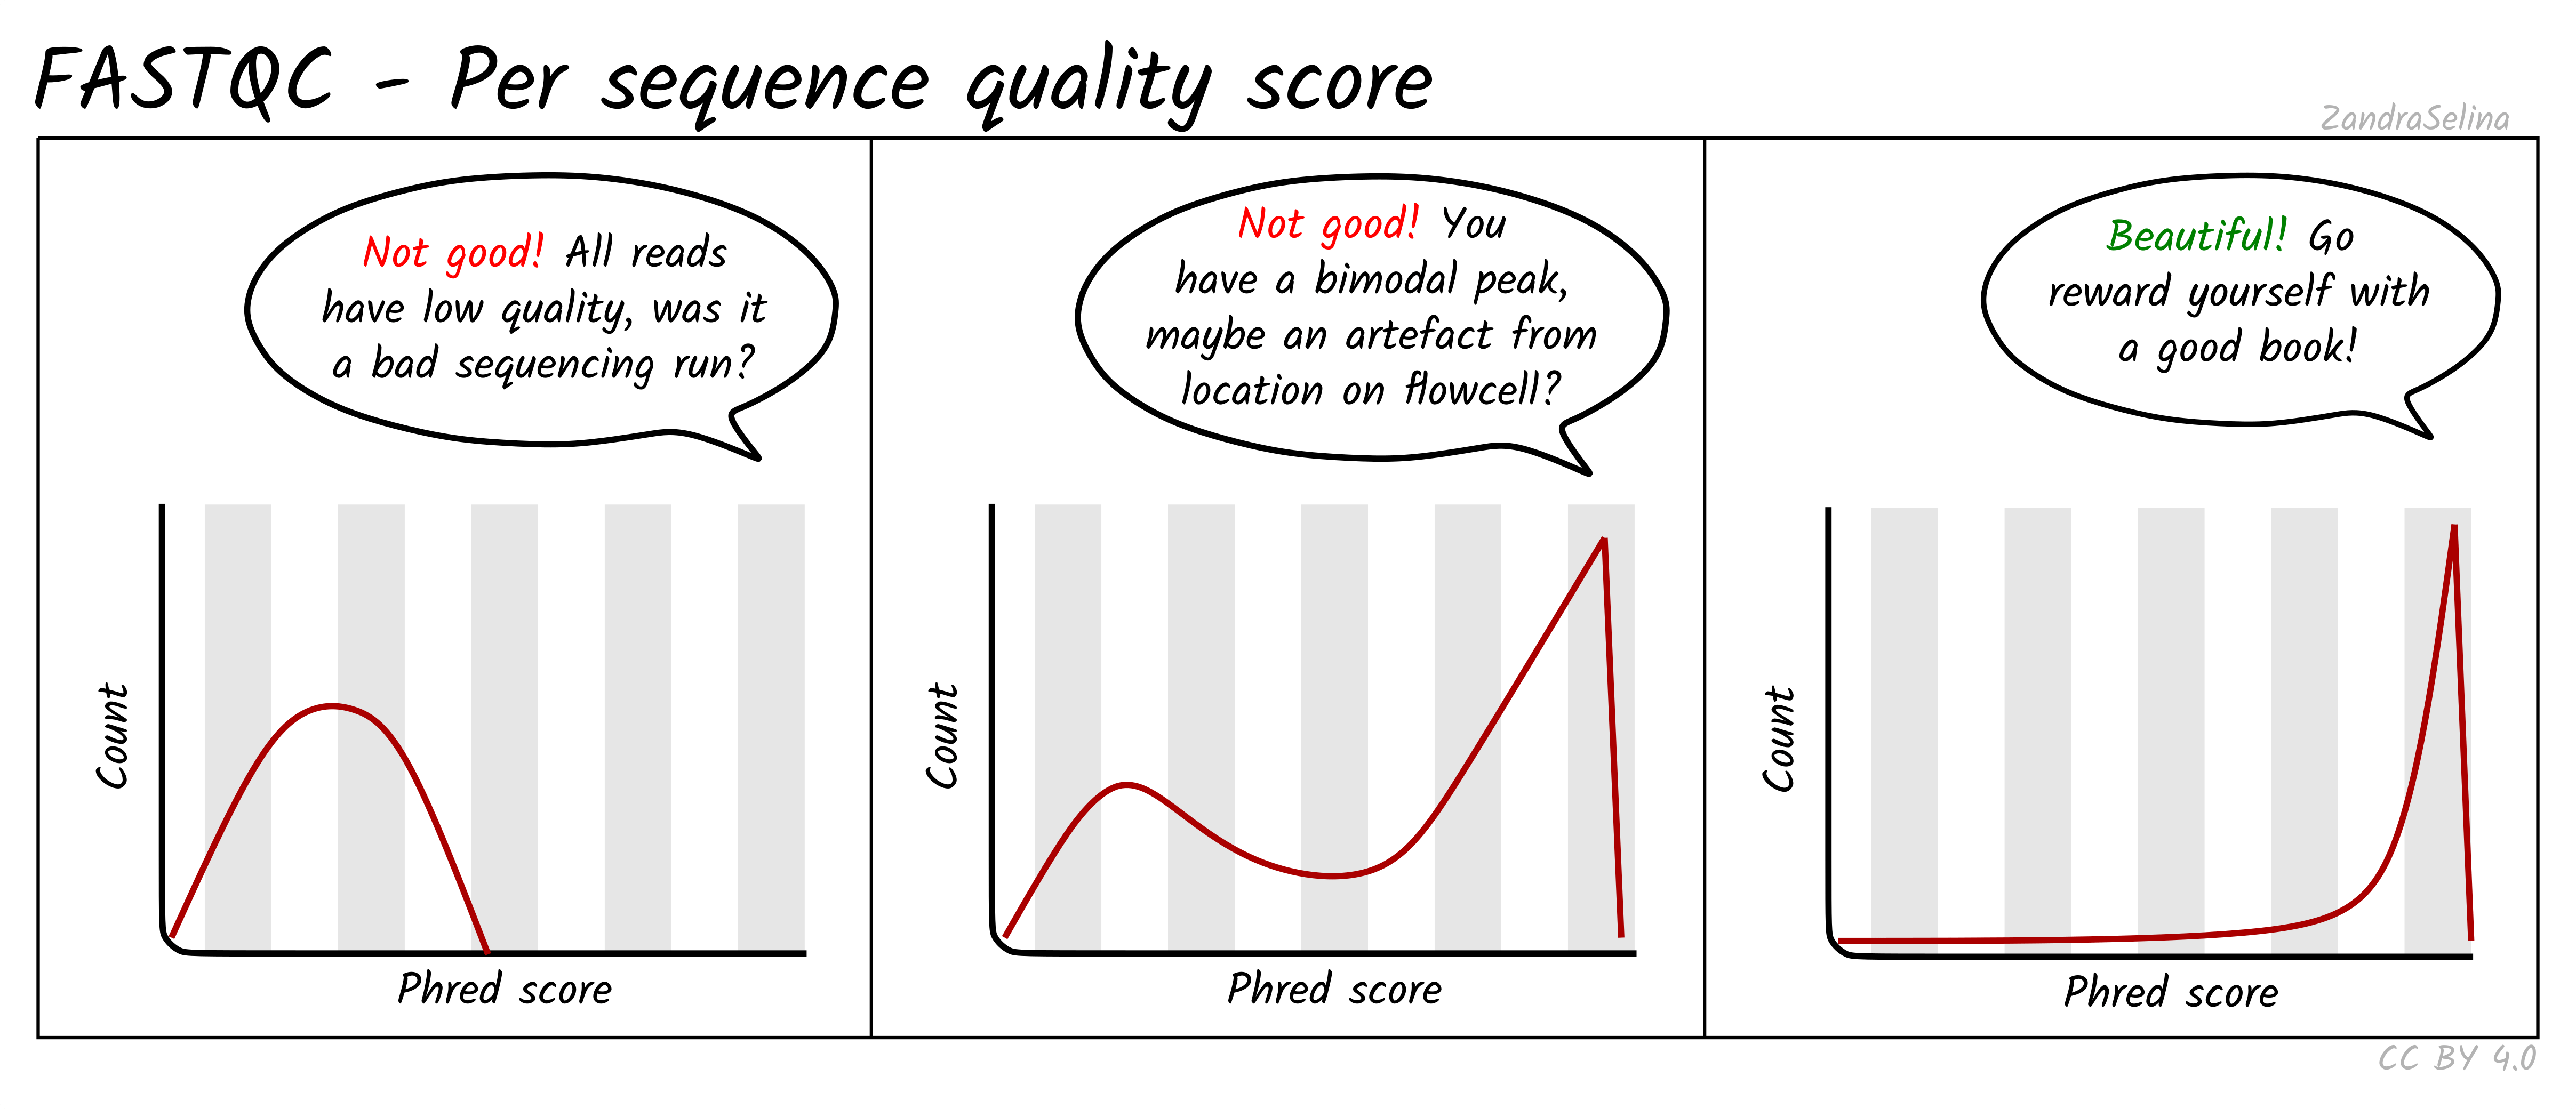
Per sequence quality scores
Shows how many reads have high or low overall quality. A good dataset has most reads with high scores and very few reads with low quality.
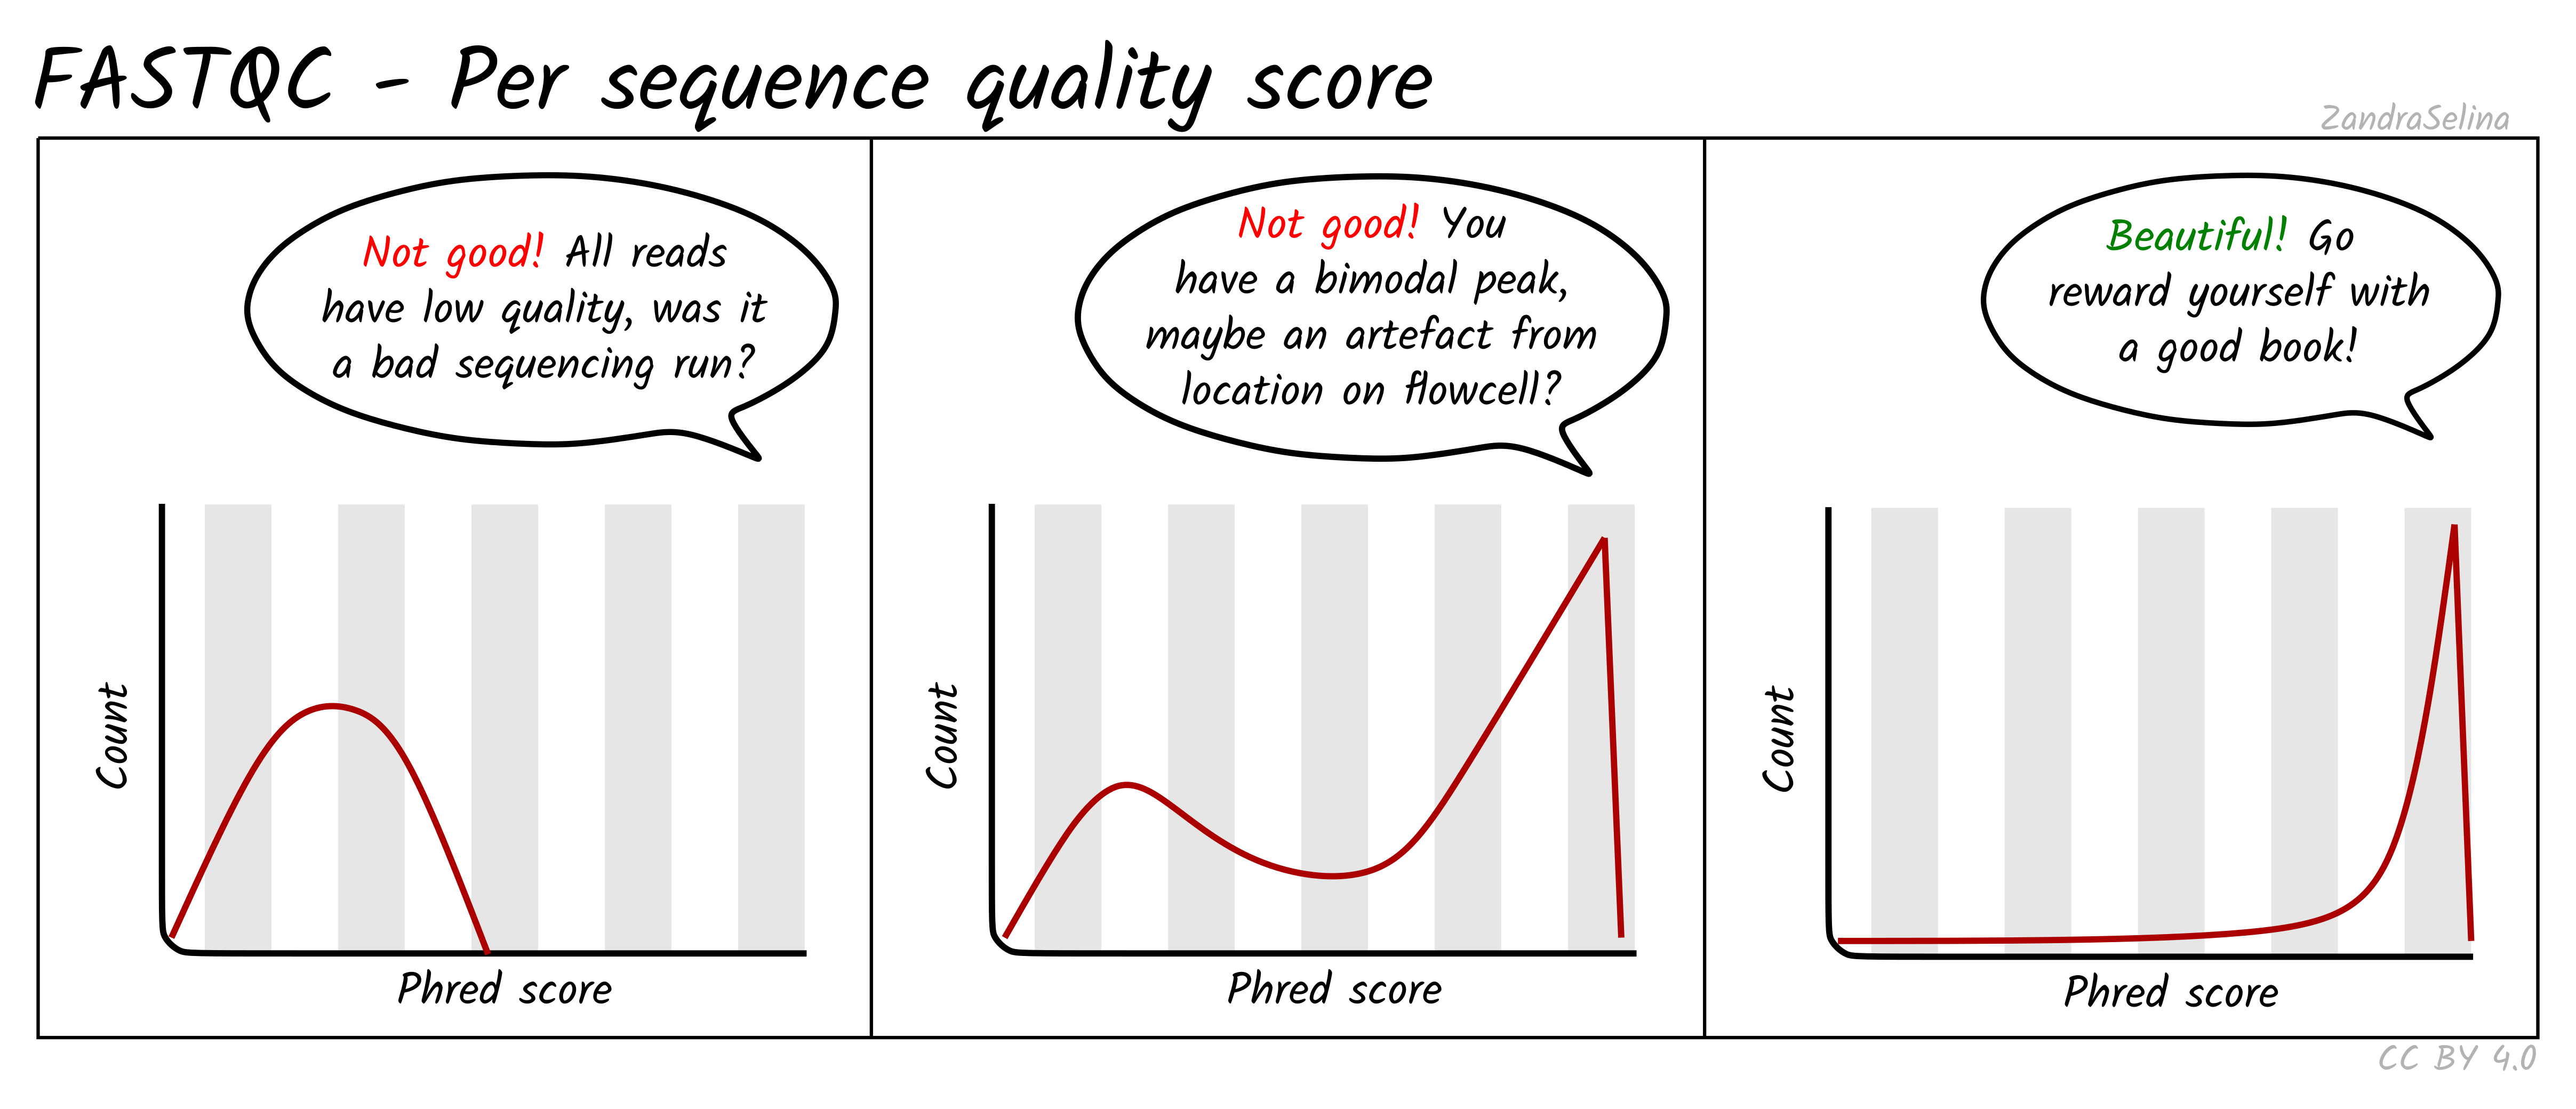
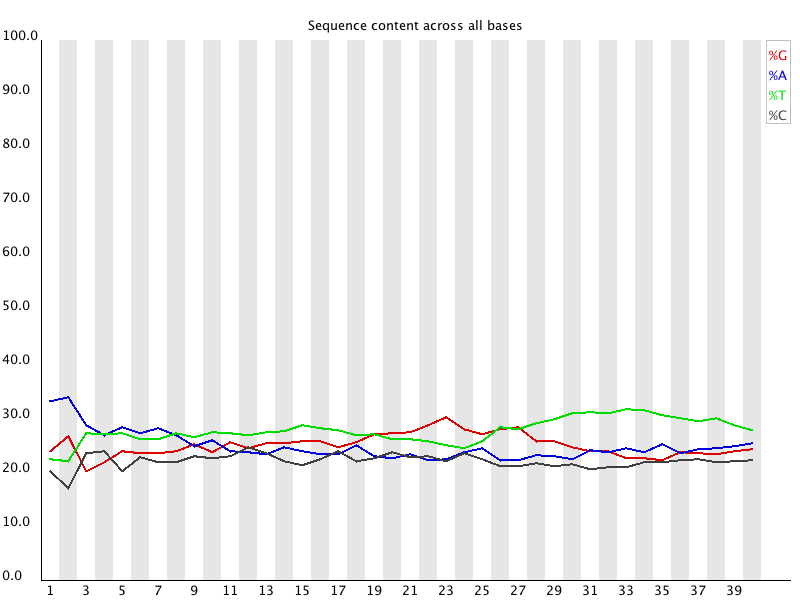
Per base sequence content
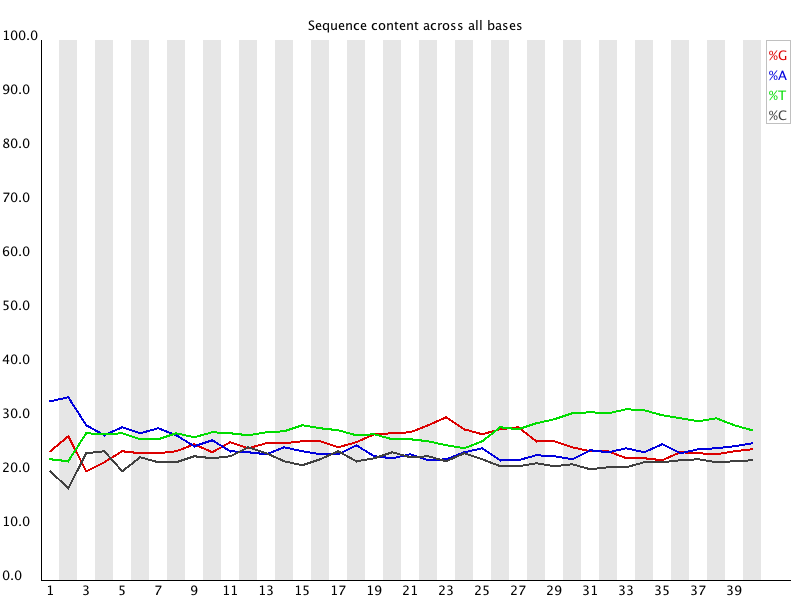
Shows the proportion of A, C, G, and T at each cycle. For genomic resequencing, all four lines should be close to 25 percent. RNA-seq usually shows imbalanced composition in early cycles due to biased priming and transcript composition. Mild imbalance at the start of the read is normal and does not require trimming.
Per sequence GC content
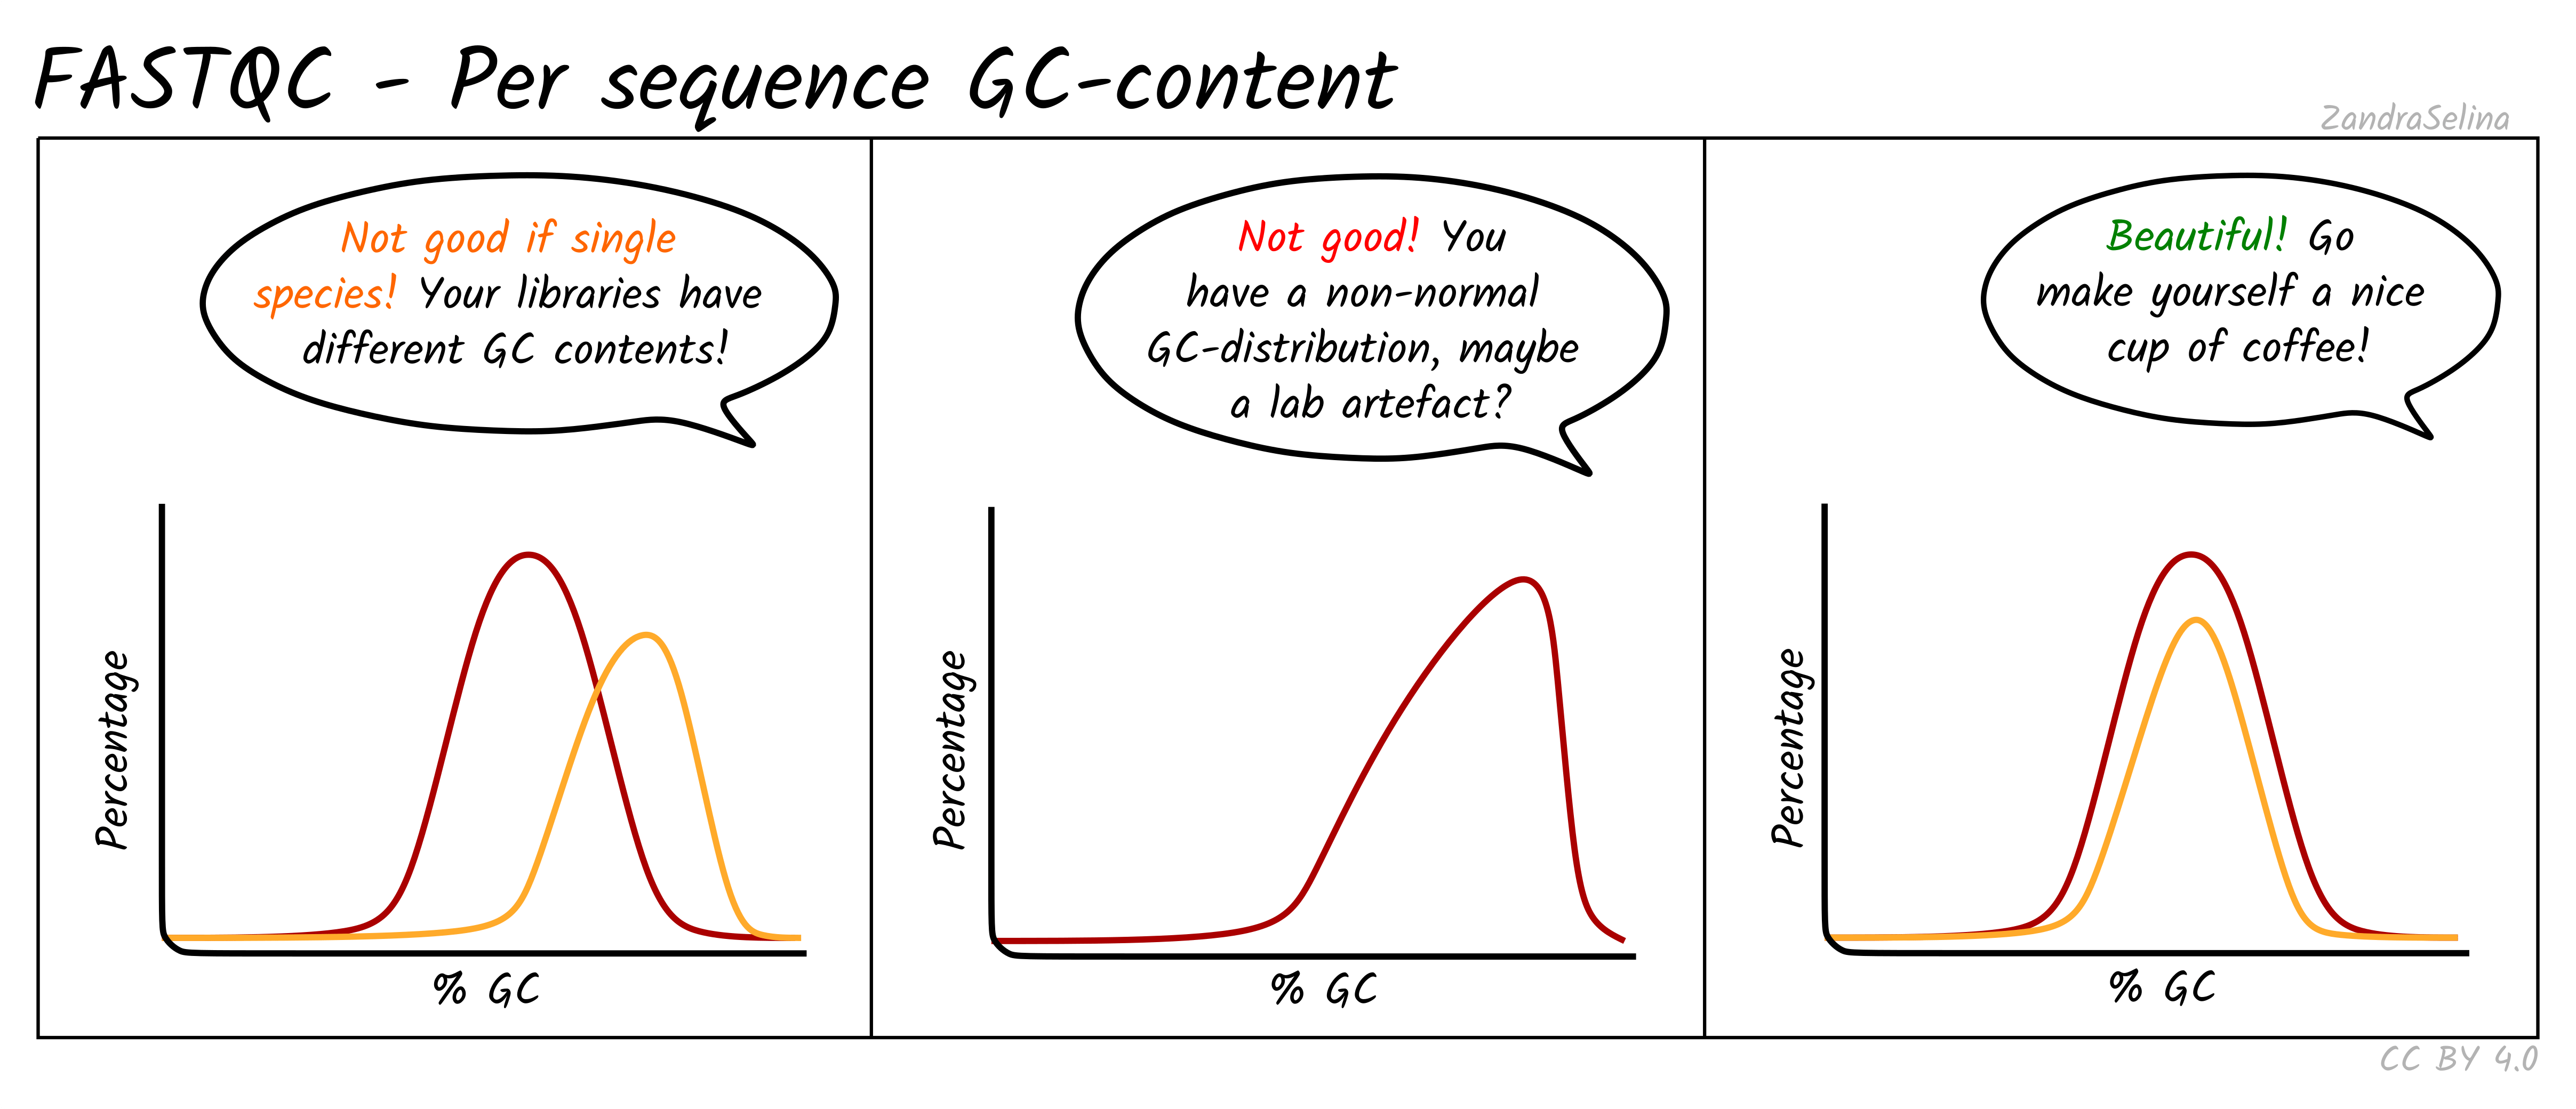
Shows the GC distribution across all reads. RNA-seq often fails this test because expressed transcripts are not GC neutral. Only pronounced multi-modal or extremely shifted distributions are concerning, for example when contamination from another organism is suspected.
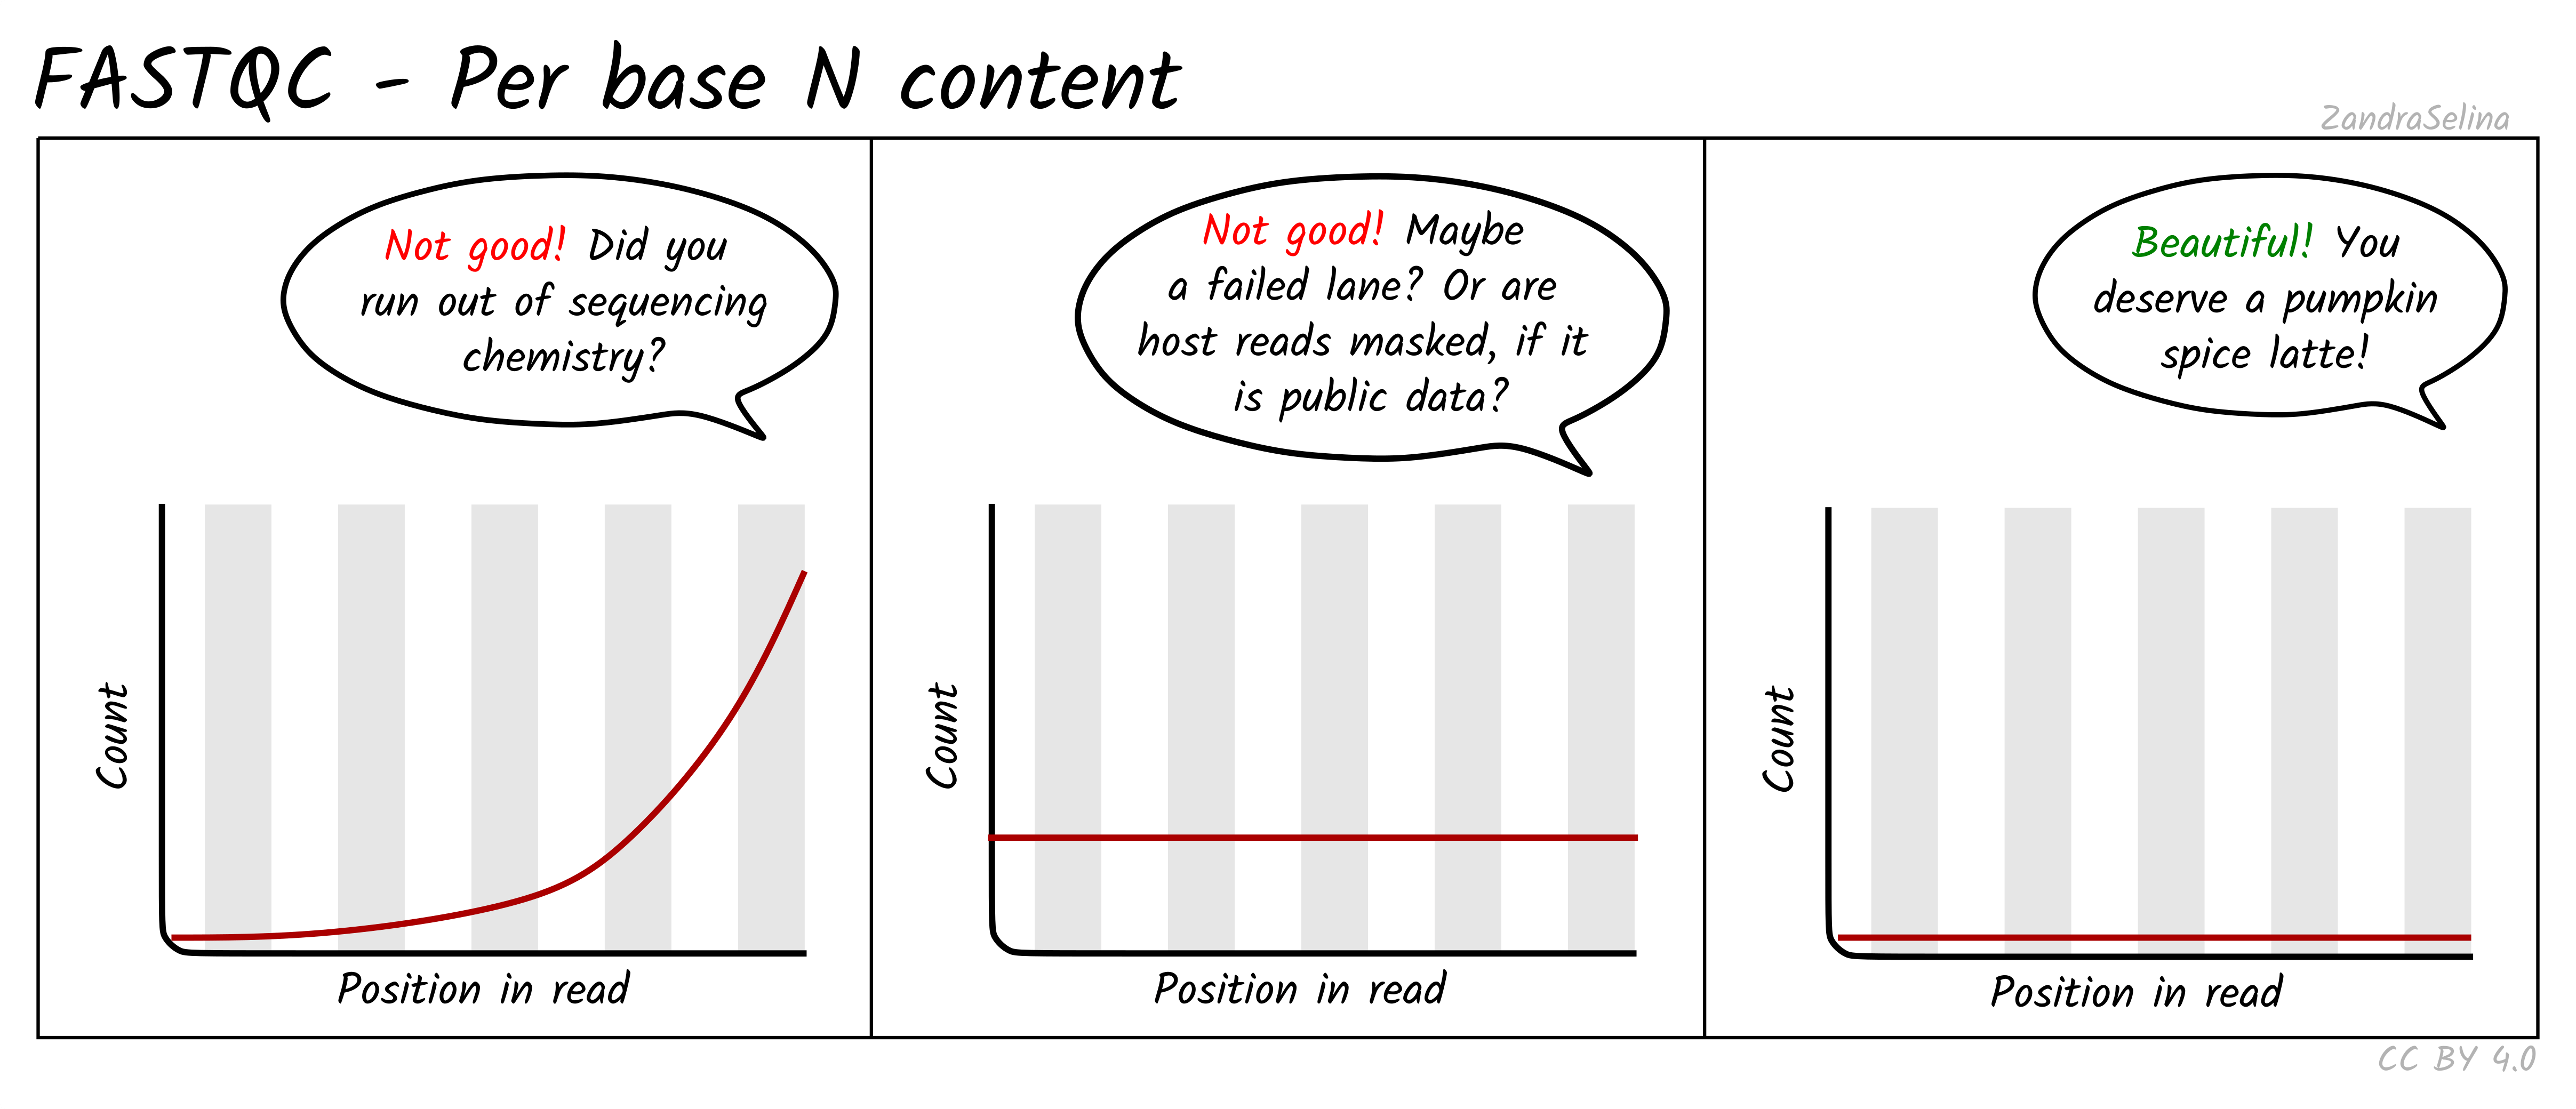
Per base N content
Reports the percentage of unidentified bases (N) at each position. This should be near zero for modern Illumina runs. High N content indicates failed cycles or poor sequencing chemistry.
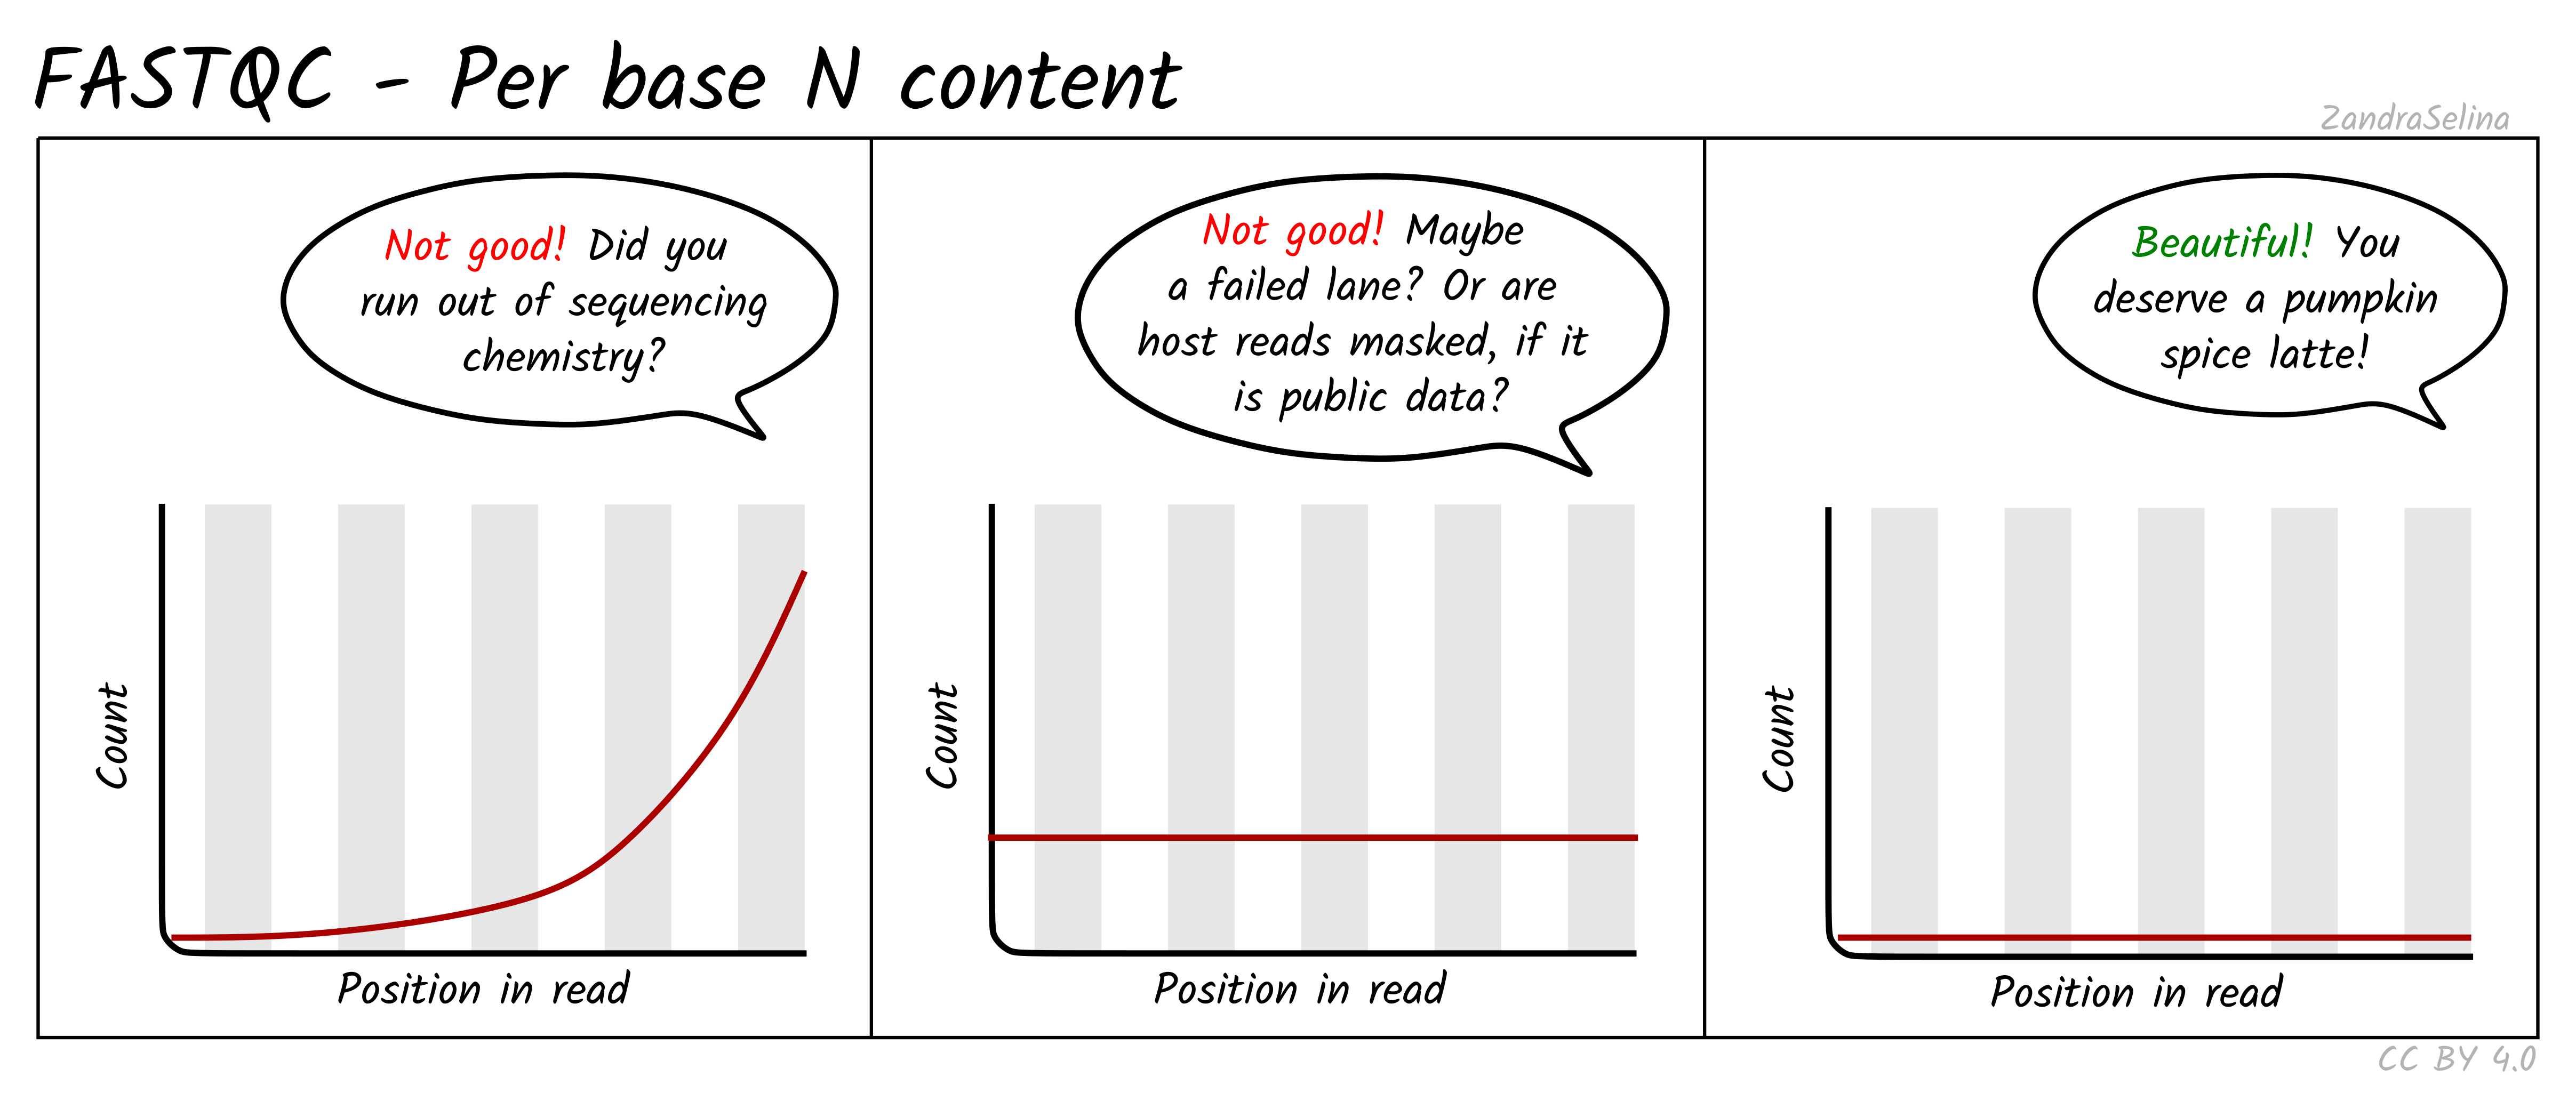
In the workshop data, the R1 files from flowcell C1PF5ACXX have 38 to 44 percent N bases at the last cycle, their R2 files 13 to 22 percent at one early cycle, and IR_rep4 R2 52 percent at cycle 27. These are failed cycles on the sequencer, not a property of the libraries.
Sequence length distribution
Shows the distribution of read lengths. Standard RNA-seq libraries should have a narrow peak at the expected read length. Variable lengths usually appear after trimming or for specialized protocols such as small RNA.
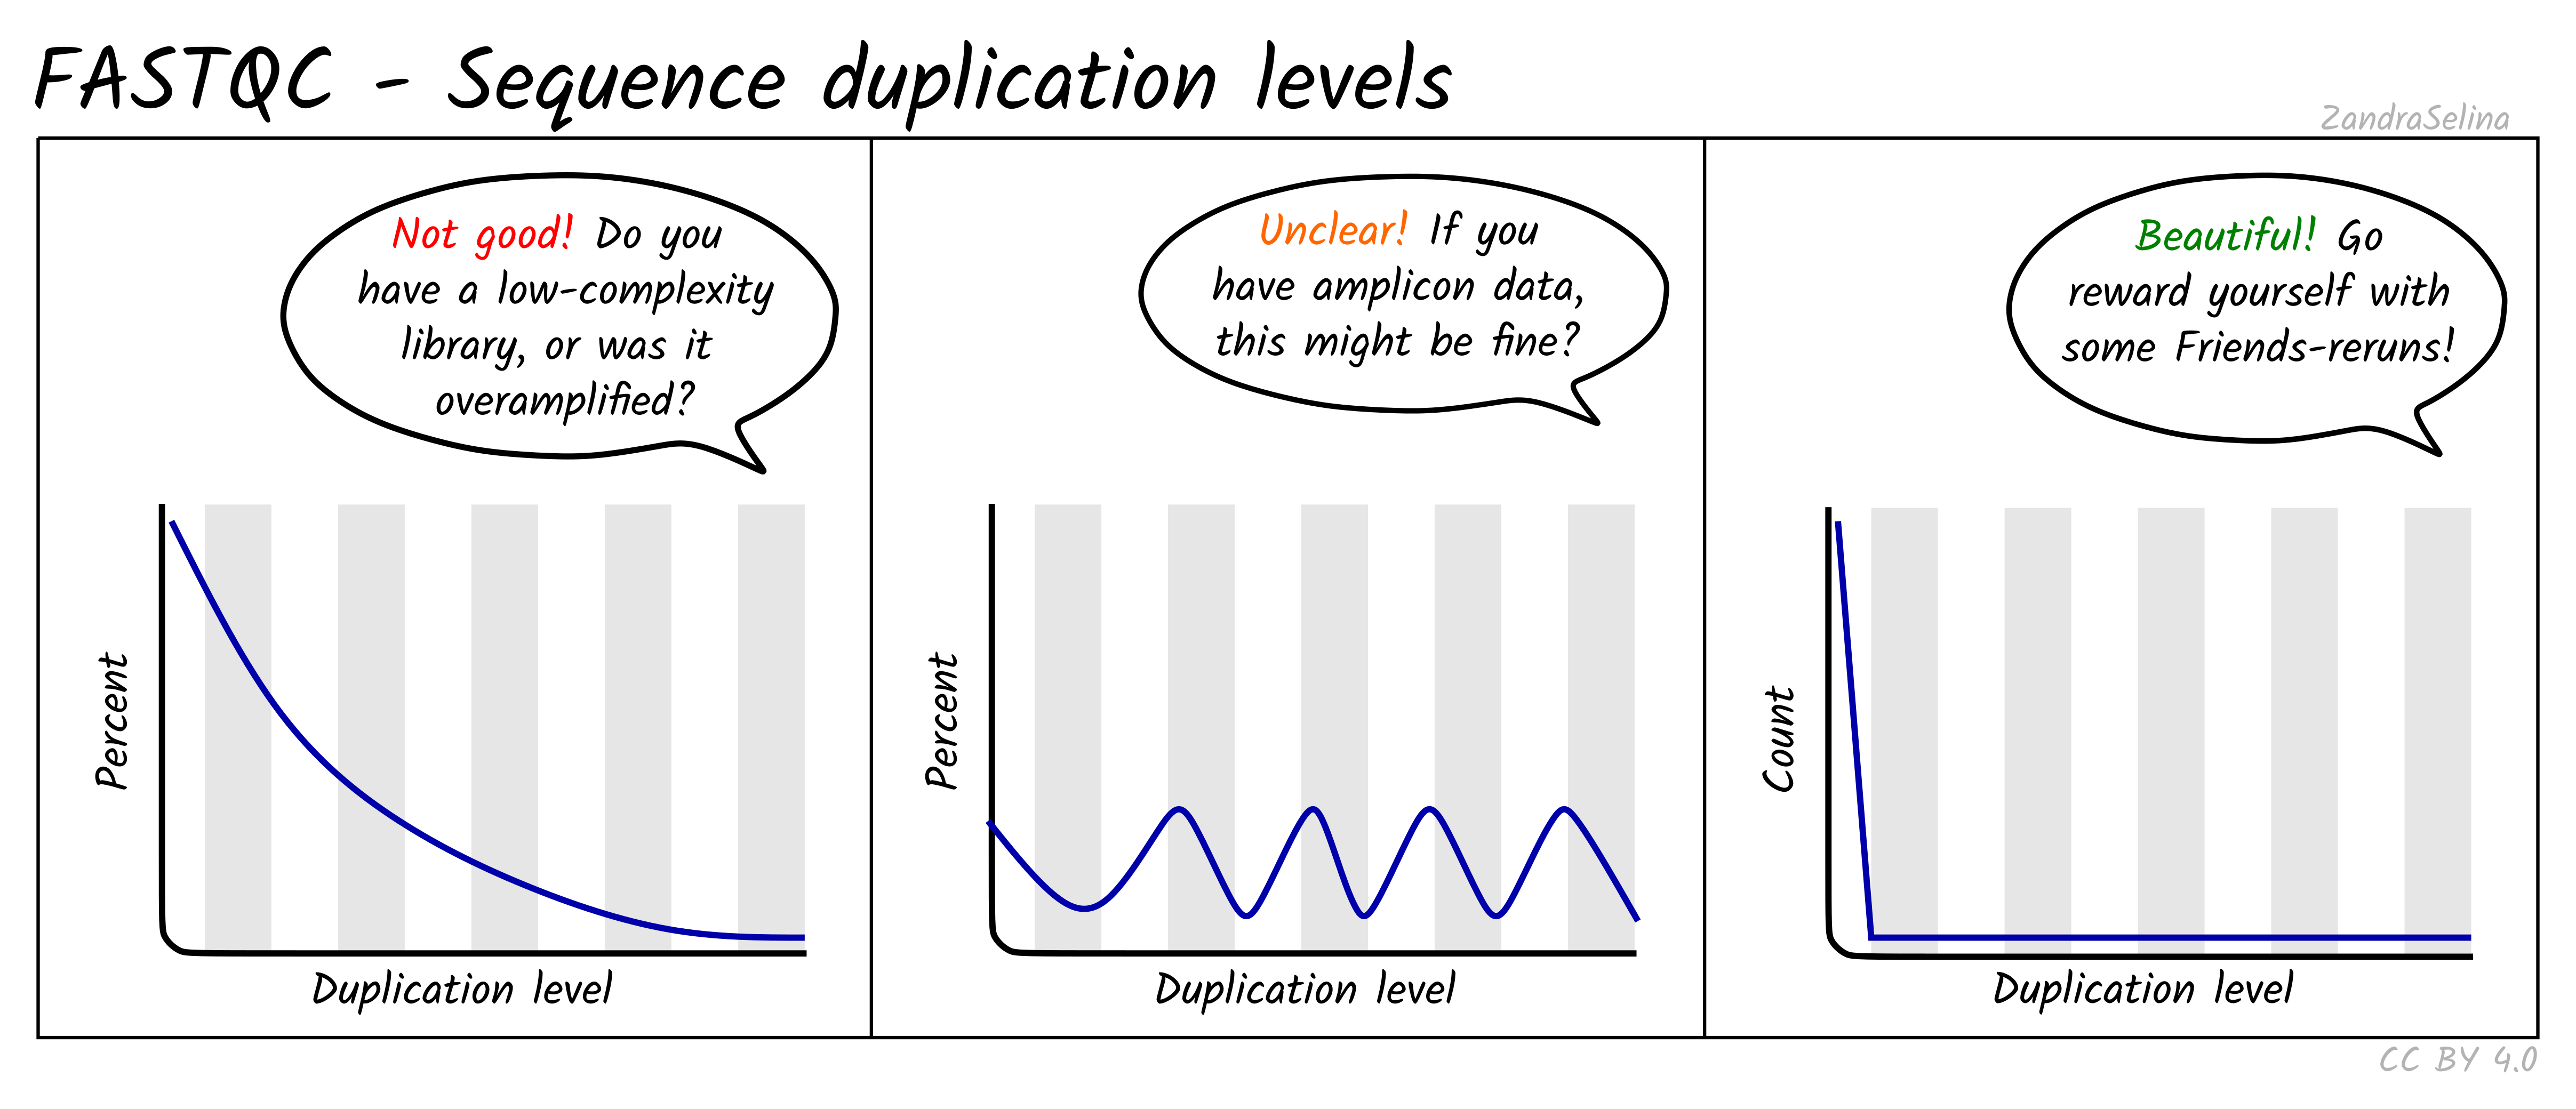
Sequence duplication levels
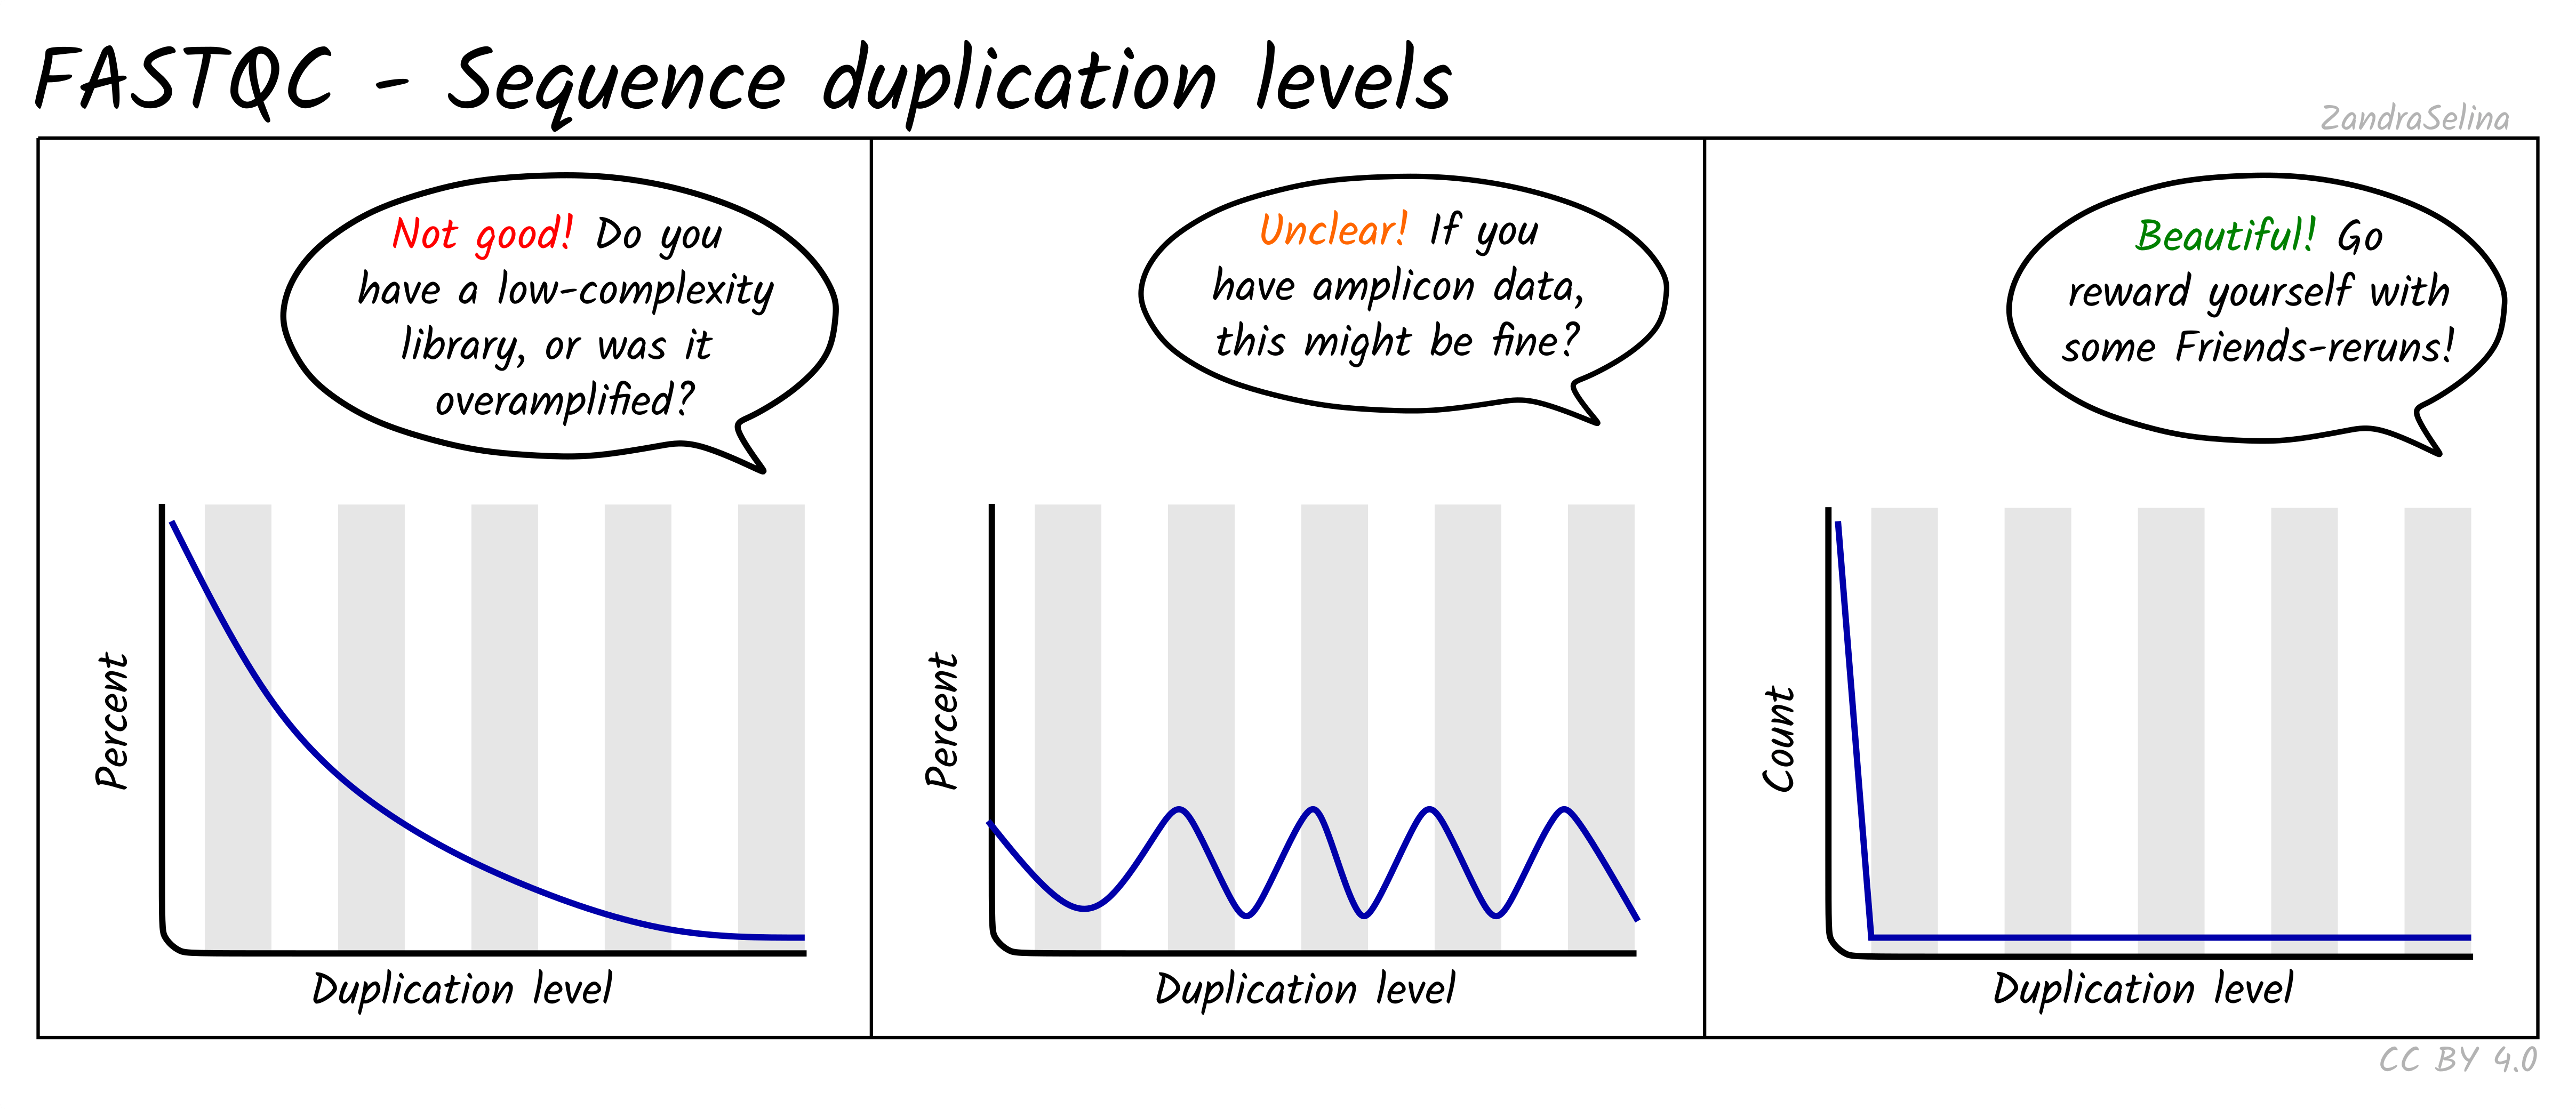
Reports how many reads are exact duplicates. Some duplication is normal in RNA-seq because highly expressed genes produce many identical fragments. Very high duplication, especially combined with low library size, can indicate low library complexity or overamplification.
Overrepresented sequences
Lists specific sequences that occur more often than expected. Common sources include ribosomal RNA fragments, poly A tails, adapter sequence, or reads from highly expressed transcripts. Some overrepresented sequences are expected, but very high levels may indicate contamination or poor rRNA depletion.
Adapter content
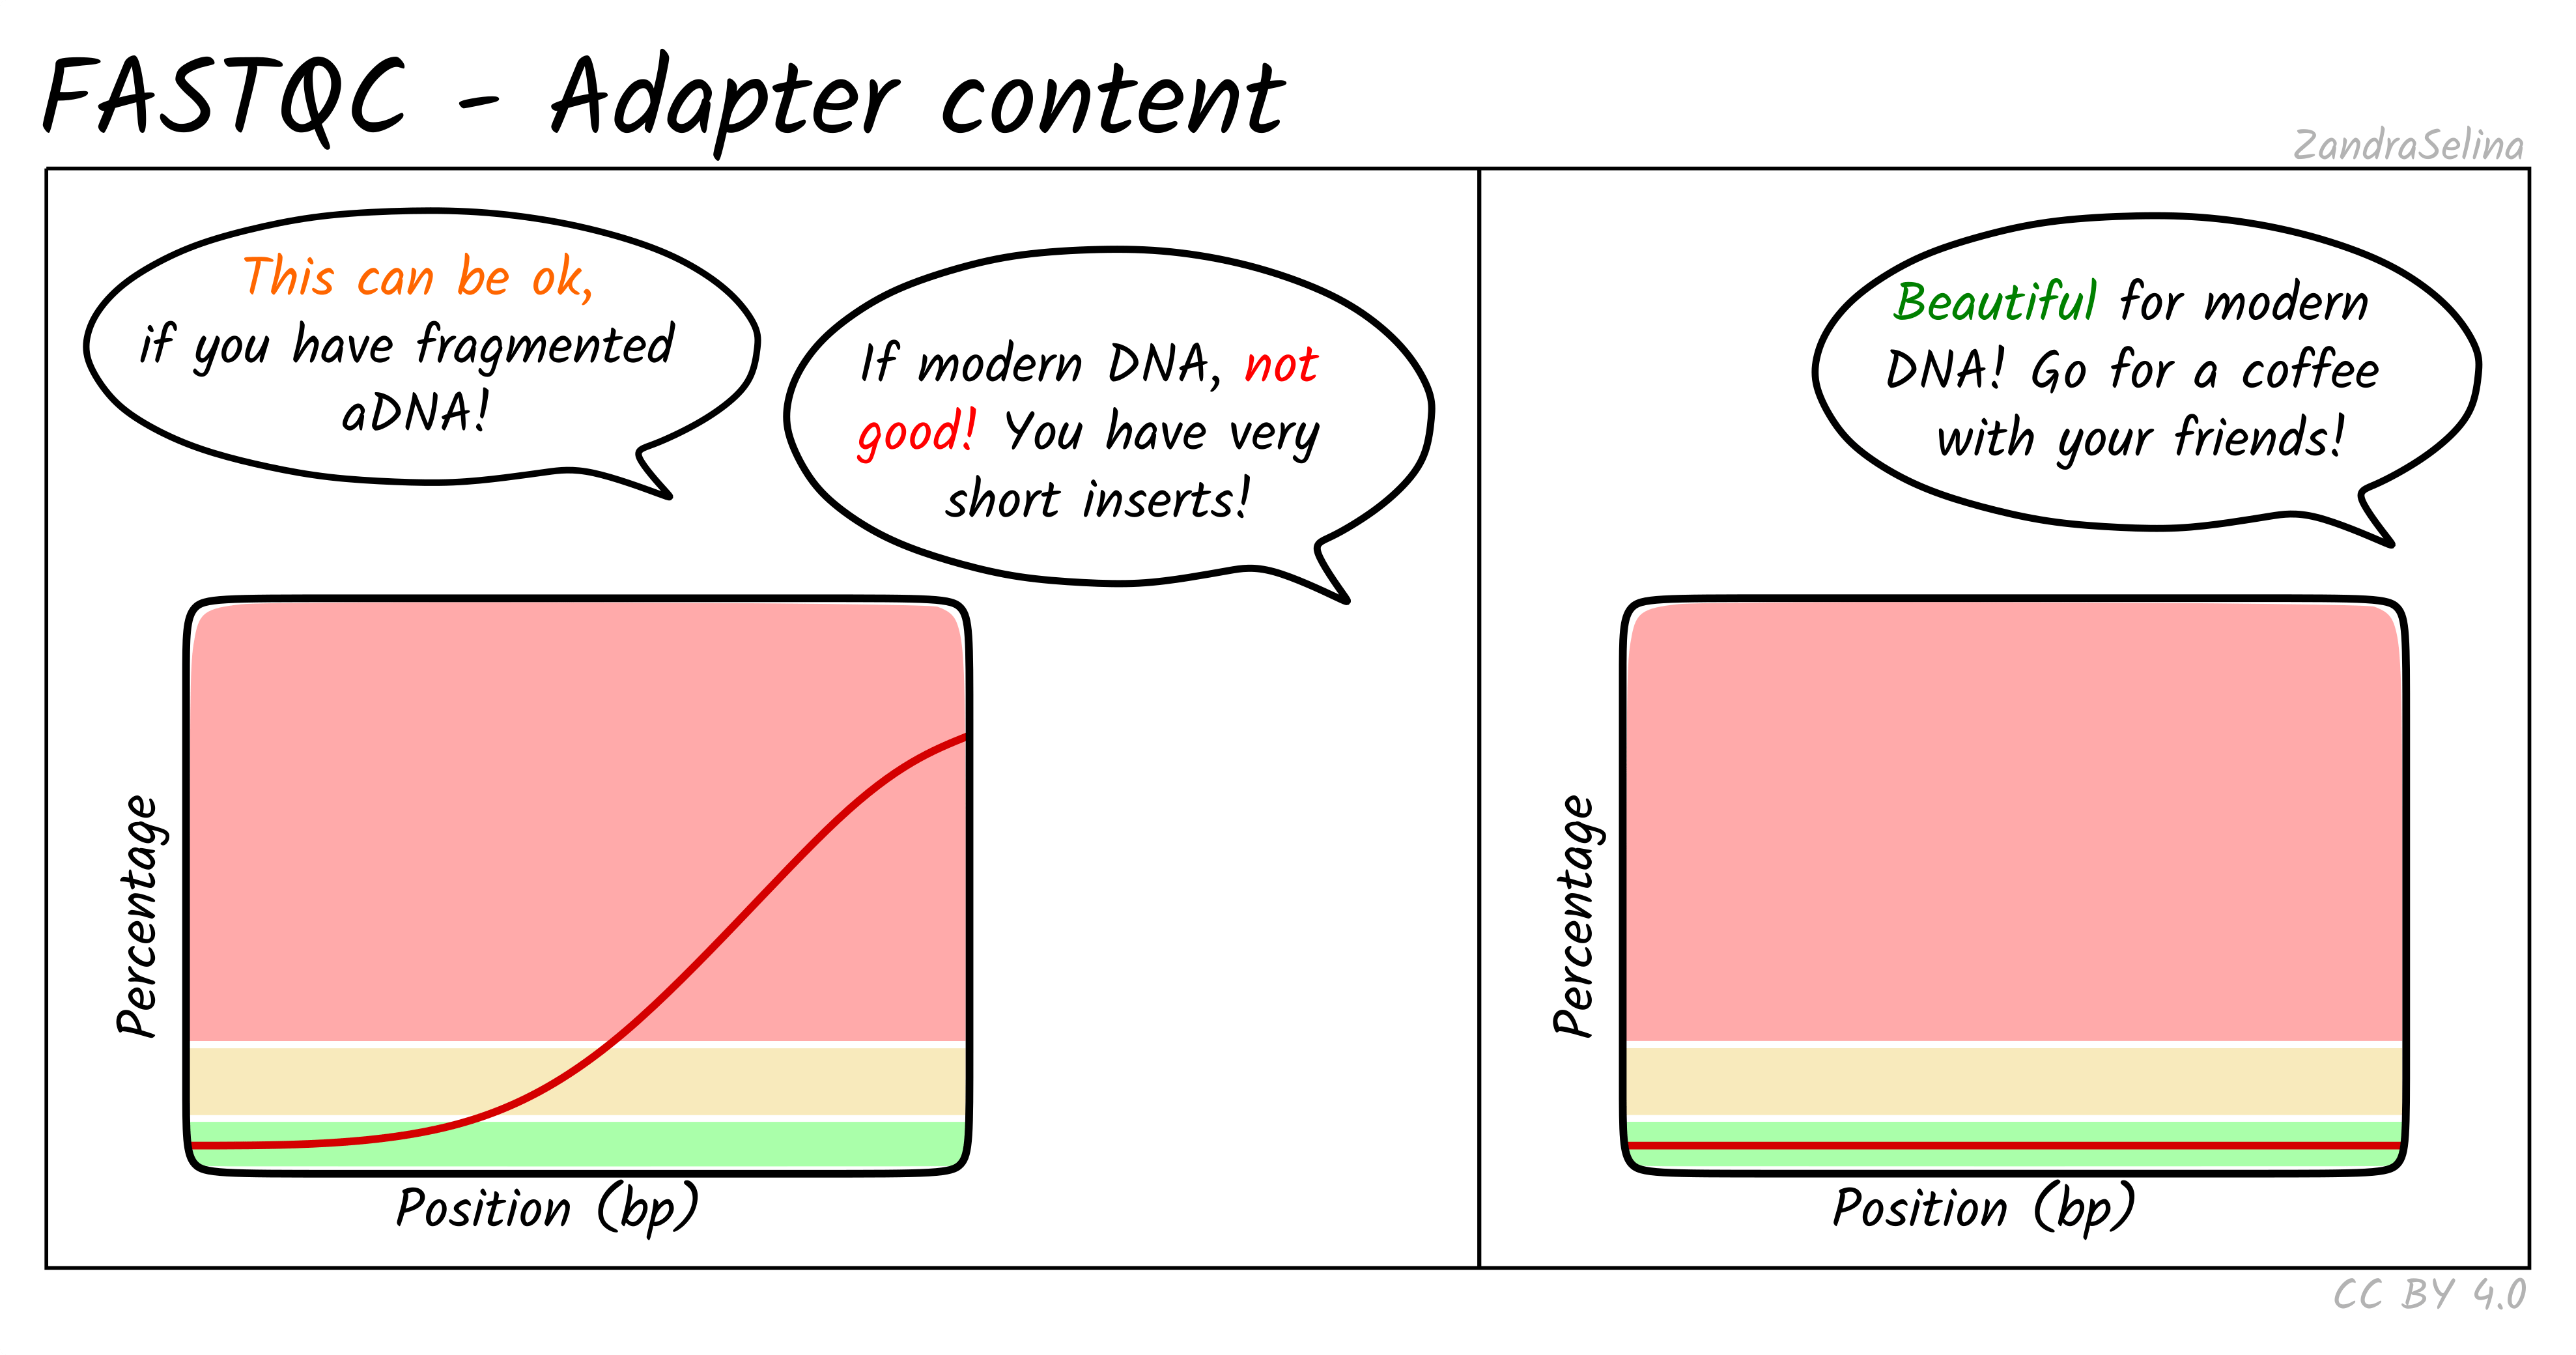
Shows whether any read cycles contain adapter sequences. Small amounts at the extreme ends are common and usually harmless. Consistently high adapter content across many cycles suggests short inserts or poorly prepared libraries.
Aggregating reports with MultiQC
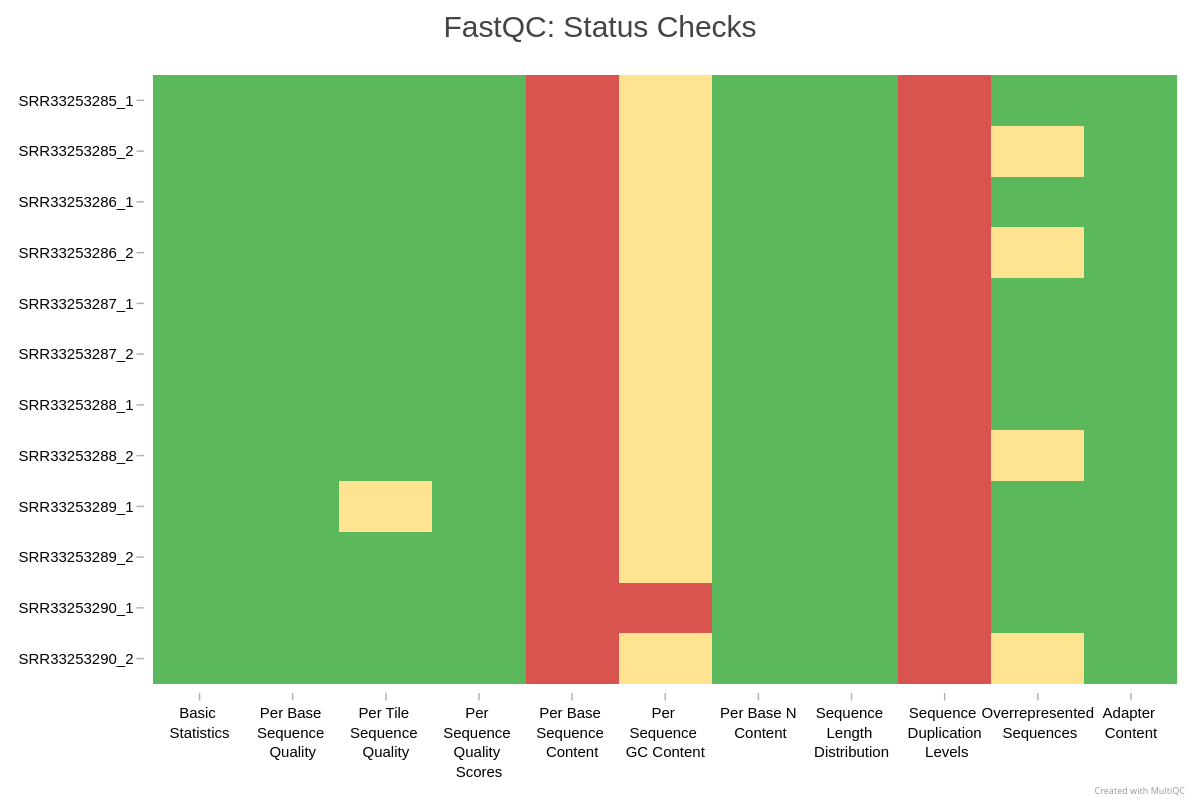
FastQC generates a separate HTML file per sample. MultiQC consolidates all reports and allows easy comparison of replicates.
Run MultiQC on the FastQC outputs
Generate a single combined report using MultiQC.
BASH
module load biocontainers
module load multiqc

cd $SCRATCH/rnaseq-workshop
multiqc results/qc_fastq/ -o results/qc_fastq/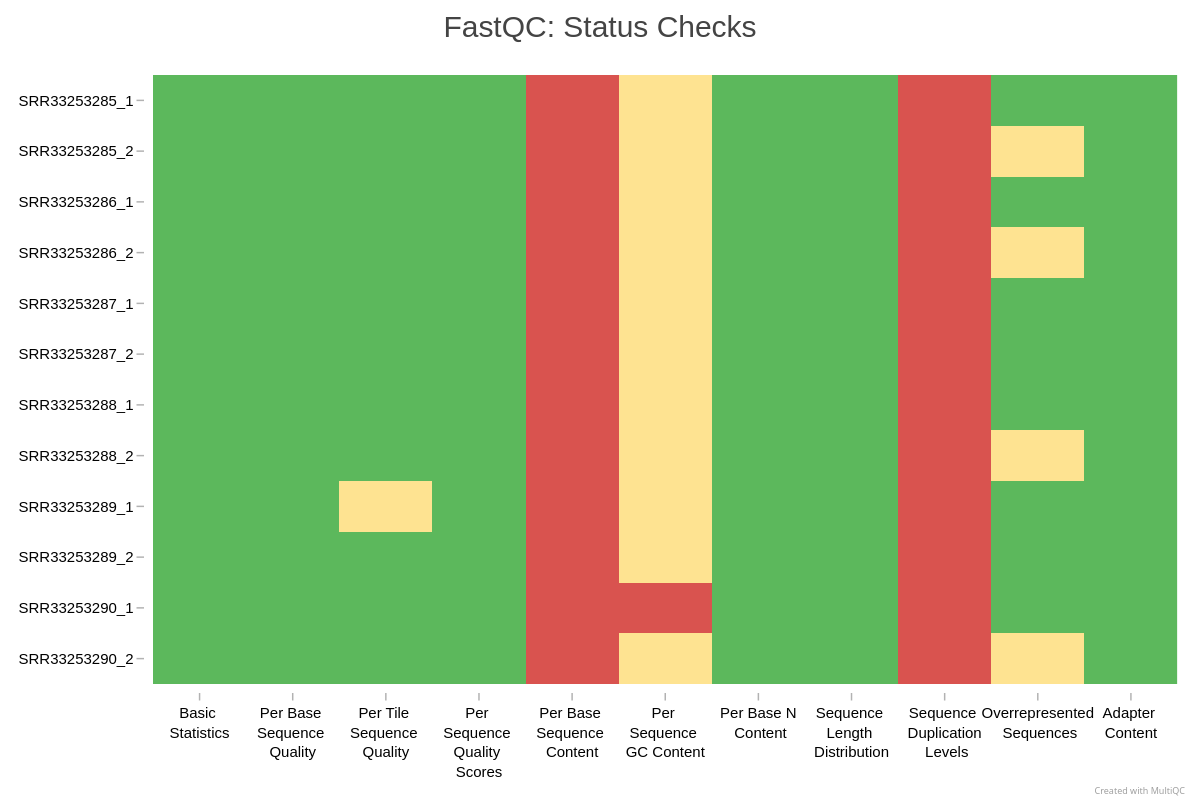
Trimming adapter sequences
Before deciding whether to trim reads, it is essential to understand what adapters are and why they appear in sequencing data.
Adapters are short synthetic DNA sequences ligated to both ends of each fragment during library preparation. They provide primer binding sites needed for cluster amplification and sequencing. Ideally, the sequenced fragment is long enough that the machine reads only biological DNA. However, when the insert is shorter than the read length, the sequencer runs into the adapter sequence, which produces adapter contamination at the ends of reads.
Many users assume that adapters must always be trimmed, but this is not true for typical RNA-seq workflows.
Do we need to trim reads for standard RNA-seq workflows?
For alignment based RNA-seq, adapter trimming is usually not required. Modern aligners such as HISAT2 and STAR detect and soft clip adapter sequence automatically. Soft-clipped bases do not contribute to mismatches or mapping penalties, so adapters generally do not harm alignment quality.
In contrast, unnecessary trimming can introduce new problems:
- shorter reads and lower mapping power
- uneven trimming across samples and artificial differences
- reduction in read complexity
- broken read pairing for paired-end sequencing
- more parameters to track for reproducibility
Trimming is recommended only in specific situations:
- very short inserts, for example degraded RNA or ancient DNA
- adapter sequence dominating read tails, for example more than 10-15 percent adapter content
- transcript assembly workflows such as StringTie or Scallop, which benefit from uniform read lengths
- small RNA or miRNA libraries, where inserts are intentionally very short and adapter presence is guaranteed
Exercise: evaluate the QC results
Inspect your MultiQC report
Using the MultiQC HTML report, answer:
- Do all replicates show similar per base sequence quality profiles?
- Is adapter content high enough to impact analysis?
- Is any sample behaving differently from the rest, for example in number of reads, quality, duplication, or GC percentage?
Interpretation for this dataset (compare with your own report):
- No. The samples fall into two groups. IR_rep3, IR_rep4, and mock_rep4 have good quality along most of the read (mean about Q33 to Q35), apart from one cycle in IR_rep4 R2 that is about half N bases and a weak last cycle in mock_rep4 R1. The other five samples are lower (mean about Q26 to Q31), their last cycle collapses (the lower quartile drops to Q2 at position 51, with 38 to 44 percent N bases in R1), and their R2 files have 13 to 22 percent N at one early cycle. FastQC fails per base sequence quality in 12 of 16 files, per tile sequence quality in 12 of 16, and per base N content in 7 of 16. These five samples were sequenced on one flowcell (C1PF5ACXX, visible in the read names) and the clean three on two others, so these are problems of that sequencing run, not of the libraries. They show up again in Episode 4A: the three clean samples have the highest STAR mapping rates.
- No. Adapter content passes in all 16 files; with 51 bp reads, very few inserts are shorter than the read.
- Besides the quality groups, duplication differs: IR_rep2 and mock_rep3 are about 96 percent unique (FastQC “deduplicated percentage”), the other samples 53 to 79 percent. This is worth recording, but it is not a reason to drop a sample at this stage. Per sequence GC content fails in 8 of 16 files, which is common for RNA-seq, as explained above.
Trimming is not needed for this dataset: adapters are absent and the aligner handles low quality read ends.
Optional reference: how to trim adapters with fastp
(not part of the hands-on)
Sometimes you may encounter datasets where trimming is appropriate, for example short inserts, small RNA, or visibly high adapter content in QC. Although we will not trim reads in this workshop, here is a minimal example you can use in your own projects if trimming becomes necessary.
fastp is a fast, widely used tool that can automatically
detect adapters, trim them, filter low quality reads, and generate QC
reports.
Summary
- FastQC and MultiQC provide essential diagnostics for RNA-seq data.
- Some FastQC warnings are normal for RNA-seq and do not indicate problems.
- Aligners soft clip adapters, so trimming is usually unnecessary for alignment based RNA-seq.
- QC helps detect outliers before alignment and quantification.