Assembly Assessment
Last updated on 2026-02-18 | Edit this page
Estimated time: 50 minutes
Overview
Questions
- Why is evaluating genome assembly quality important?
- What tools can be used to assess assembly completeness, accuracy, and structural integrity?
- How do you interpret key metrics from assembly evaluation tools?
- What are the main steps in evaluating a genome assembly using bioinformatics tools?
Objectives
- Understand the importance of evaluating genome assembly quality.
- Learn about tools for assessing assembly completeness, accuracy, and structural integrity.
- Interpret key metrics from assembly evaluation tools to guide further analysis.
- Evaluate a genome assembly using bioinformatics tools such as QUAST, Compleasm, Merqury, and Bandage.
Evaluating Assembly Quality
Assessing genome assembly quality is essential to ensure completeness, accuracy, and structural integrity before downstream analyses. Different tools provide complementary insights—QUAST evaluates assembly contiguity, Compleasm assesses gene-space completeness, Merqury validates k-mer consistency, and Bandage visualizes assembly graphs for structural assessment. Together, these methods help identify errors, improve genome reconstruction, and ensure high-quality results.
Why is Assembly Evaluation Important?
-
Detects misassemblies and structural errors:
Identifies fragmented, misjoined, or incorrectly placed contigs that can
impact genome interpretation.
-
Measures completeness and accuracy: Ensures that
essential genes and expected genome regions are properly assembled and
not missing or duplicated.
-
Validates sequencing data quality: Confirms whether
sequencing errors, biases, or artifacts affect the final assembly.
- Guides further refinement: Helps decide whether additional polishing, scaffolding, or reassembly is needed for better genome reconstruction.
Quast for quality metrics
You can run quast to evaluate the quality of your genome
assembly. It is also useful for comparing multiple assemblies to
identify the best one based on key metrics such as contig count, N50,
and misassemblies.
BASH
ml --force purge
ml biocontainers
ml quast
mkdir -p quast_evaluation
# Link your assemblies to a common directory for comparison
mkdir -p all_assemblies
# PacBio HiFi assemblies
ln -sf ../02_pacbio-hifi/hifiasm_default/At_hifiasm_default.asm.bp.p_ctg.fasta all_assemblies/hifiasm_default.fasta
ln -sf ../02_pacbio-hifi/flye_hifi/assembly.fasta all_assemblies/flye_hifi.fasta
# ONT assemblies
ln -sf ../03_ont-assembly/flye_ont/assembly.fasta all_assemblies/flye_ont.fasta
ln -sf ../03_ont-assembly/hifiasm_ont/At_hifiasm_ont.asm.bp.p_ctg.fasta all_assemblies/hifiasm_ont.fasta
# Hybrid assembly
ln -sf ../04_hybrid-assembly/hybrid_flye_out/assembly.fasta all_assemblies/hybrid_flye.fasta
# Bionano scaffolded assemblies
ln -sf ../05_scaffolding/hifiasm_bionano_scaffolded.fasta all_assemblies/hifiasm_bionano.fasta
ln -sf ../05_scaffolding/flye_bionano_scaffolded.fasta all_assemblies/flye_bionano.fasta
# Download the reference genome
wget -q -O TAIR10_reference.fasta.gz \
   "https://ftp.ensemblgenomes.org/pub/plants/release-57/fasta/arabidopsis_thaliana/dna/Arabidopsis_thaliana.TAIR10.dna.toplevel.fa.gz"
gunzip TAIR10_reference.fasta.gz
quast.py \
   --output-dir quast_comparison \
   --min-contig 3000 \
   -r TAIR10_reference.fasta \
   --threads ${SLURM_CPUS_PER_TASK} \
   --eukaryote \
   --pacbio ../01_data-qc/At_pacbio-hifi-filtered.fastq \
   all_assemblies/*.fasta
This will generate a detailed report in the
quast_comparison directory, including key metrics for each
assembly and a summary of their quality. You can use this information to
compare different assemblies and select the best one for downstream
analysis.
Viewing QUAST reports
Open quast_comparison/report.html in your browser for an
interactive QUAST report with sortable tables and plots. The Icarus
viewer (icarus.html) provides a visual alignment of your
contigs against the TAIR10 reference chromosomes.
| Metric | flye_bionano | flye_hifi | flye_ont | hifiasm_bionano | hifiasm_default | hifiasm_ont | hybrid_flye |
|---|---|---|---|---|---|---|---|
| # Contigs | 42 | 83 | 50 | 153 | 146 | 105 | 333 |
| Total length (Mb) | 128.97 | 133.68 | 128.74 | 143.79 | 135.75 | 127.42 | 121.11 |
| N50 (Mb) | 15.52 | 5.97 | 11.82 | 14.05 | 7.98 | 11.34 | 4.06 |
| L50 | 4 | 8 | 5 | 5 | 7 | 6 | 9 |
| auN (Mb) | 13.77 | 5.64 | 10.68 | 10.87 | 7.70 | 8.70 | 4.58 |
| Genome fraction (%) | 99.41 | 90.47 | 99.43 | 86.71 | 86.68 | 95.58 | 90.76 |
| # Misassemblies | 198 | 484 | 183 | 836 | 824 | 59 | 480 |
| Mismatches/100kbp | 26.71 | 707.09 | 26.76 | 695.76 | 660.03 | 65.99 | 702.30 |
| Indels/100kbp | 20.77 | 113.17 | 20.77 | 111.45 | 111.66 | 38.96 | 115.37 |
| N’s per 100kbp | 177.79 | 0.00 | 0.00 | 5593.53 | 0.00 | 0.00 | 0.00 |
| Avg. coverage depth | 67x | 45x | 67x | 60x | 63x | 86x | 60x |
Key observations: - Best contiguity: flye_bionano (N50=15.52 Mb, only 42 contigs) - Best genome fraction: flye_ont (99.43%) and flye_bionano (99.41%) - Fewest misassemblies: hifiasm_ont (59), far fewer than any other assembly - Best base accuracy: Flye-based ONT assemblies (26.7 mismatches/100kbp) vs HiFi-based (~660-707 mismatches/100kbp) — this counterintuitive result is because QUAST aligns to TAIR10 and HiFi assemblies retain haplotypic variants that score as “mismatches” - N’s only in Bionano-scaffolded assemblies: gaps introduced during scaffolding
Compleasm for genome completeness (gene-space)
Similarly, you can use compleasm to assess the
completeness of your genome assembly in terms of gene-space
representation. This tool compares the assembly against a set of
conserved genes to estimate the level of completeness and identify
missing or fragmented genes.
BASH
ml --force purge
ml biocontainers
ml compleasm
mkdir -p compleasm_evaluation
cd compleasm_evaluation
# Use the same assemblies linked in the all_assemblies directory
for fasta in ../all_assemblies/*.fasta; do
  compleasm run \
    -a ${fasta} \
    -o ${fasta%.*}_out \
    -l brassicales_odb10  \
    -t ${SLURM_CPUS_PER_TASK}
done
This will generate a detailed report for each assembly in the
directory, highlighting the completeness of conserved genes and
potential gaps in the genome reconstruction. The assessment result by
compleasm is saved in the file summary.txt in the
compleasm_evaluation/assemblyN_out (specified in output
-o option) folder. These BUSCO genes are categorized into
the following classes:
-
S(Single Copy Complete Genes): The BUSCO genes that can be entirely aligned in the assembly, with only one copy present. -
D(Duplicated Complete Genes): The BUSCO genes that can be completely aligned in the assembly, with more than one copy present. -
F(Fragmented Genes, subclass 1): The BUSCO genes which only a portion of the gene is present in the assembly, and the rest of the gene cannot be aligned. -
I(Fragmented Genes, subclass 2): The BUSCO genes in which a section of the gene aligns to one position in the assembly, while the remaining part aligns to another position. -
M(Missing Genes): The BUSCO genes with no alignment present in the assembly.
| Assembly | Single (S) | Duplicated (D) | Fragmented (F) | Missing (M) |
|---|---|---|---|---|
| flye_bionano | 98.93% | 1.07% | 0.00% | 0.00% |
| flye_hifi | 98.89% | 1.04% | 0.02% | 0.04% |
| flye_ont | 98.93% | 1.07% | 0.00% | 0.00% |
| hifiasm_bionano | 95.97% | 1.09% | 0.02% | 2.92% |
| hifiasm_default | 95.97% | 1.11% | 0.02% | 2.89% |
| hifiasm_ont | 98.61% | 1.04% | 0.00% | 0.35% |
| hybrid_flye | 98.50% | 1.41% | 0.02% | 0.07% |
Key observations: - Best completeness: flye_bionano
and flye_ont (98.93% single, 0% missing) - HiFiasm default has
~3% missing genes: This is due to aggressive purging
(-l 3), which removes some legitimate single-copy regions
along with haplotigs - Bionano scaffolding does not change BUSCO
scores: hifiasm_default and hifiasm_bionano have identical
completeness, confirming scaffolding only reorders contigs
Merqury for evaluating genome assembly
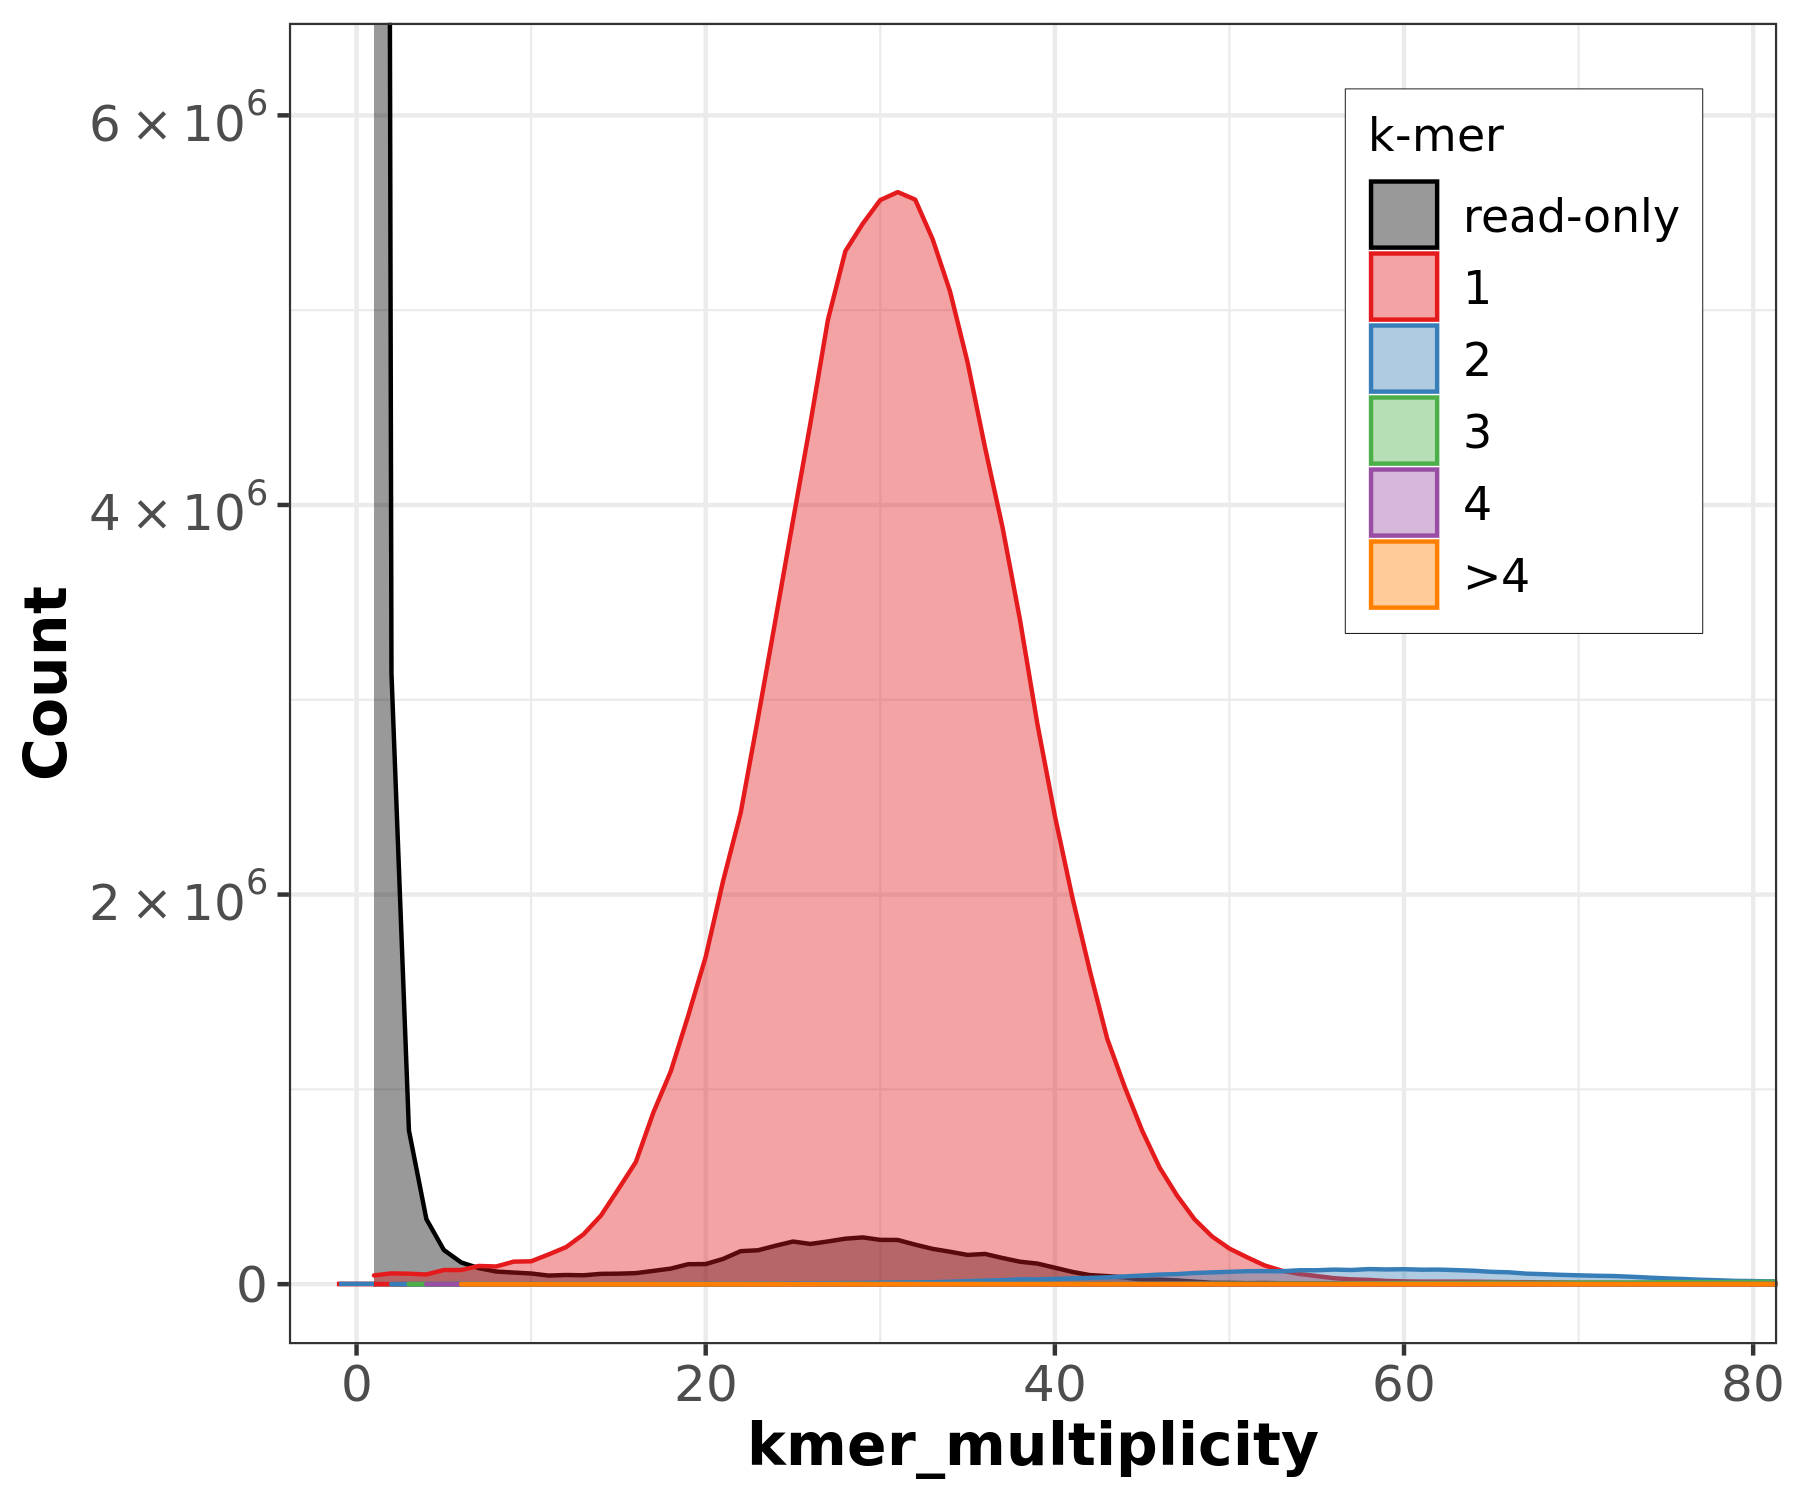
Merqury is a tool for reference-free assembly evaluation based on efficient k-mer set operations. It provides insights into various aspects of genome assembly, offering a comprehensive view of genome quality without relying on a reference sequence. Specifically, Merqury can generate the following plots and metrics:
-
Copy Number Spectrum (Spectra-cn Plot):
- A k-mer-based analysis that detects heterozygosity
levels and genome repeats by identifying peaks in k-mer coverage.
- Helps estimate genome size, detect missing regions, and distinguish between homozygous and heterozygous k-mers in an assembly.
- A k-mer-based analysis that detects heterozygosity
levels and genome repeats by identifying peaks in k-mer coverage.
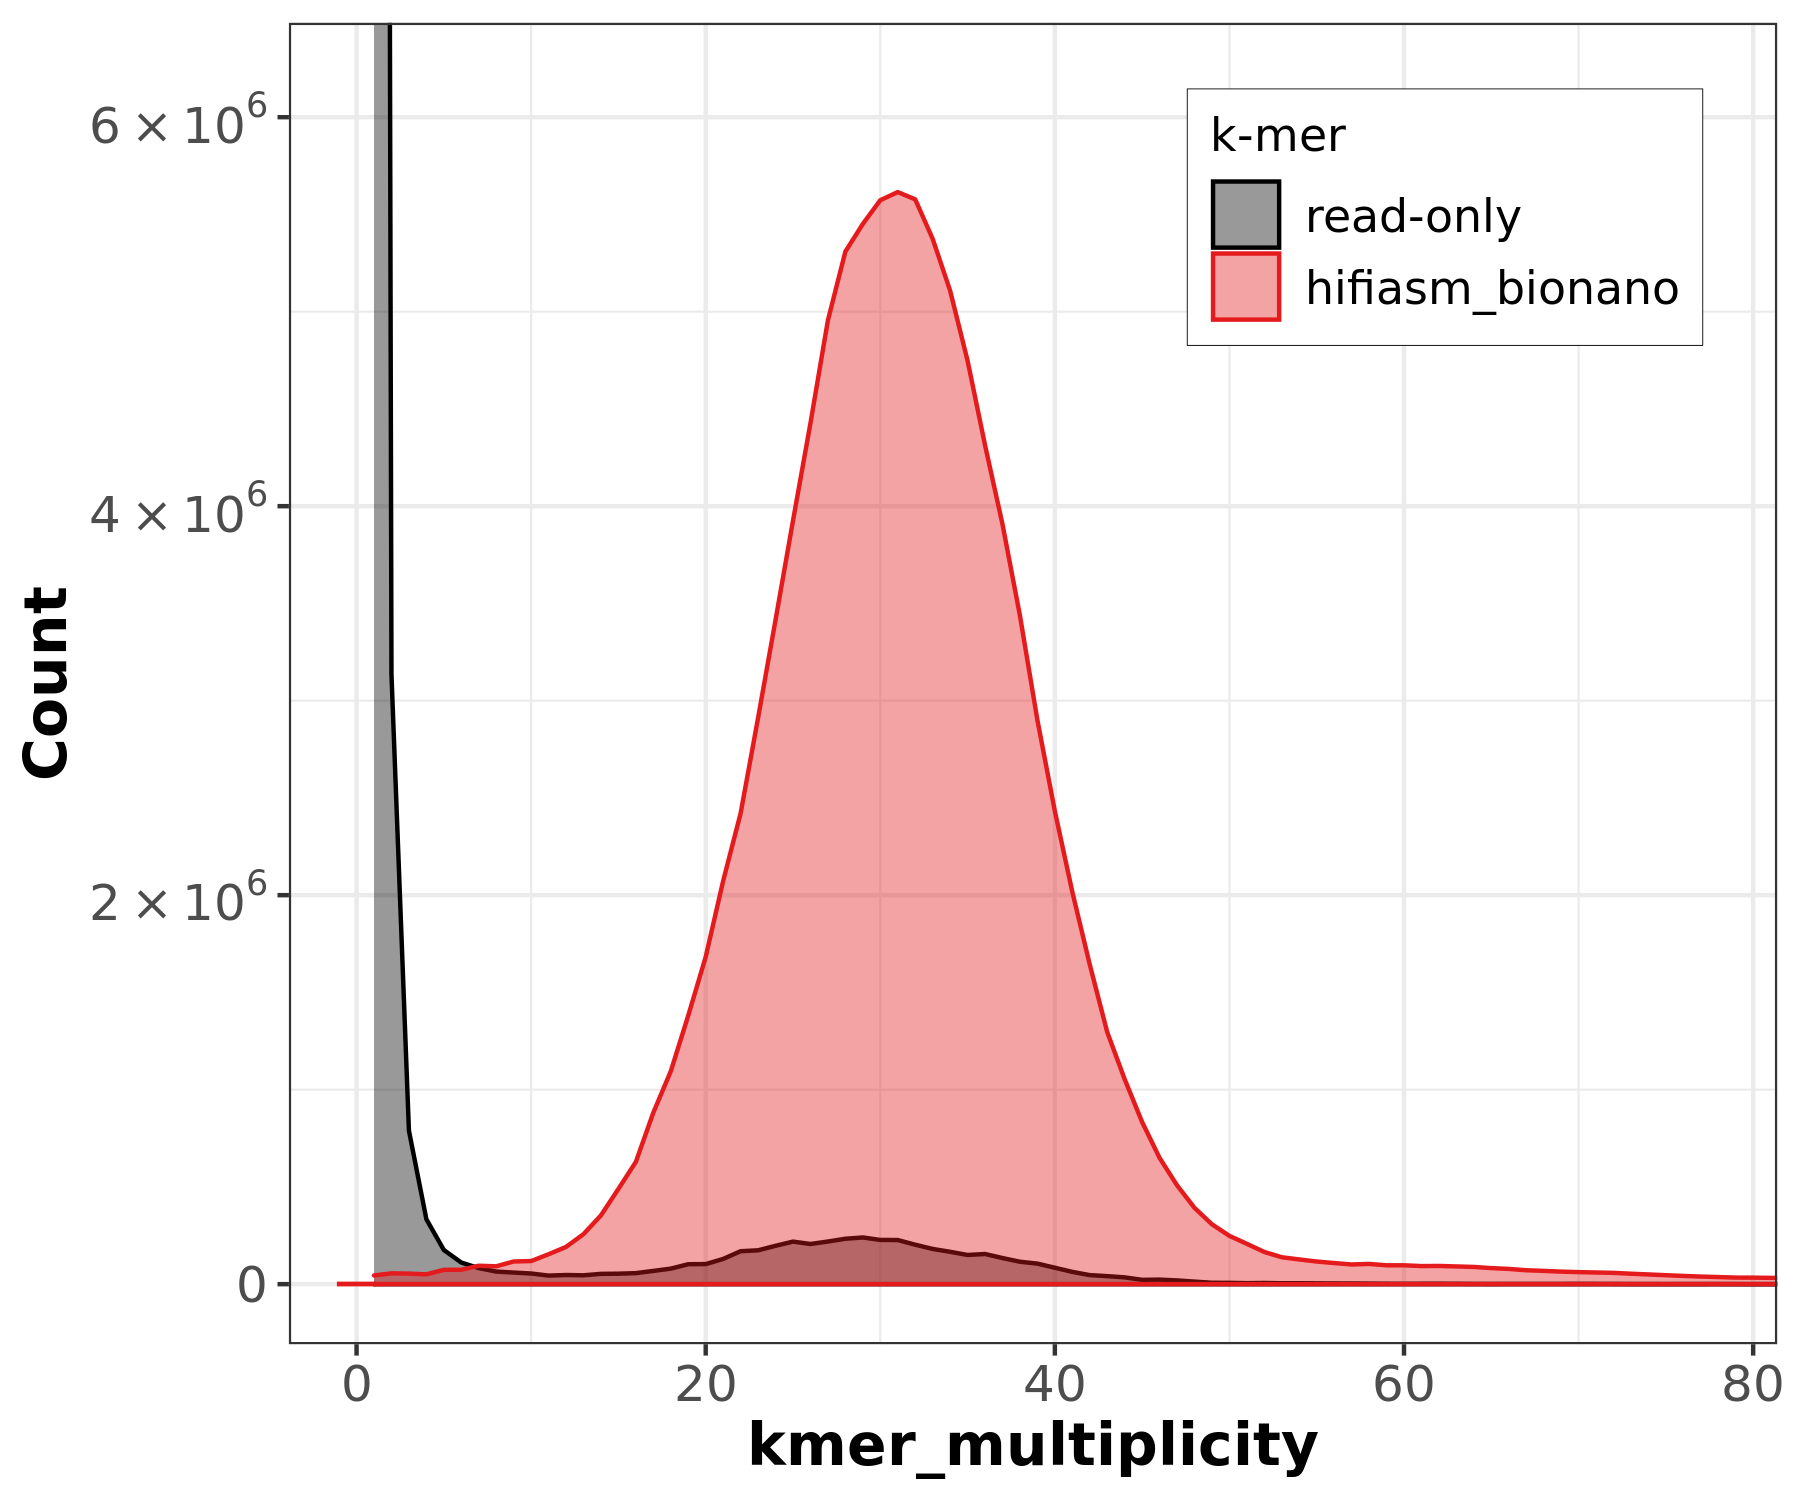
-
Assembly Spectrum (Spectra-asm Plot):
- Compares k-mers between different assemblies or between an assembly
and raw sequencing reads.
- Useful for detecting missing sequences, shared regions, and assembly-specific k-mers that may indicate errors or haplotype-specific variations.
- Compares k-mers between different assemblies or between an assembly
and raw sequencing reads.
-
K-mer Completeness:
- Measures how many reliable k-mers (those likely to
be real and not sequencing errors) are present in both the sequencing
reads and the assembly.
- Helps identify missing regions, misassemblies, and sequencing biases affecting genome reconstruction.
- Measures how many reliable k-mers (those likely to
be real and not sequencing errors) are present in both the sequencing
reads and the assembly.
-
Consensus Quality (QV) Estimation:
- Uses k-mer agreement between the assembly and the read
set to estimate base-level accuracy.
- Higher QV scores indicate a more accurate consensus sequence, but results depend on read quality and coverage depth.
- Uses k-mer agreement between the assembly and the read
set to estimate base-level accuracy.
-
Misassembly Detection with K-mer Positioning:
- Identifies unexpected k-mers or false
duplications in assemblies, reporting their positions in
.bedand.tdffiles for visualization in genome browsers. - Helps pinpoint structural errors such as collapsed repeats, chimeric joins, or large insertions/deletions.
- Identifies unexpected k-mers or false
duplications in assemblies, reporting their positions in
This k-mer-based approach in Merqury provides reference-free genome quality evaluation, making it highly effective for de novo assemblies and structural validation.
BASH
ml --force purge
ml biocontainers
ml merqury
ml meryl
mkdir -p merqury_evaluation
cd merqury_evaluation
# Step 1: Build a meryl k-mer database from the filtered HiFi reads
meryl \
   count k=21 \
   threads=${SLURM_CPUS_PER_TASK} \
   memory=8g \
   output reads.meryl \
   ../../01_data-qc/At_pacbio-hifi-filtered.fastq
# Step 2: Run merqury to evaluate assemblies
# Syntax: merqury.sh <read-db.meryl> <asm1.fasta> [asm2.fasta] <output_prefix>
# For a single assembly:
merqury.sh \
   reads.meryl \
   ../../02_pacbio-hifi/hifiasm_default/At_hifiasm_default.asm.bp.p_ctg.fasta \
   merqury_hifiasm
# For comparing multiple assemblies:
merqury.sh \
   reads.meryl \
   ../../02_pacbio-hifi/hifiasm_default/At_hifiasm_default.asm.bp.p_ctg.fasta \
   ../../03_ont-assembly/flye_ont/assembly.fasta \
merqury_comparisonMerqury syntax
Note that merqury.sh uses positional
arguments (not flags):
merqury.sh <read-db.meryl> <assembly1.fasta> [assembly2.fasta] <output_prefix>The output prefix determines the names of all generated files. When comparing two assemblies, provide both FASTA files before the output prefix.
This will generate numerous files with the specified output prefix, including k-mer spectra plots, completeness metrics, and consensus quality (QV) estimates for each assembly. You can use these results to evaluate the accuracy, completeness, and structural integrity of your genome assemblies.
For the hifiasm_bionano assembly:
| Metric | Value |
|---|---|
| Consensus Quality (QV) | 62.91 |
| Error rate | 5.11 x 10^-7 |
| K-mer completeness | 95.73% |
| K-mers found | 104,602,794 / 109,271,894 |
A QV of 62.91 corresponds to approximately 1 error per ~2 million bases, indicating extremely high base-level accuracy. The k-mer completeness of 95.73% means nearly all reliable k-mers from the reads are represented in the assembly.
Interpreting Merqury output files: -
merqury_out.qv: Assembly name, error k-mers, total k-mers,
QV score, error rate - merqury_out.completeness.stats:
Assembly name, set type, found k-mers, total k-mers, completeness % -
merqury_out.spectra-cn.*.png: Copy number spectrum plot -
merqury_out.spectra-asm.*.png: Assembly spectrum plot
Assembly graph visualization using Bandage
Bandage is a tool for visualizing assembly graphs, which represent the connections between contigs or scaffolds in a genome assembly. By visualizing the graph structure, you can identify complex regions, repetitive elements, and potential misassemblies that may affect the genome reconstruction.
To visualize the assembly graph using Bandage:
- Open a web browser and navigate to desktop.negishi.rcac.purdue.edu.
- Log in with your Purdue Career Account username and password, but append “,push” to your password.
- Launch the terminal and run the following command:
- In the Bandage interface, navigate to your assembly folder and load
your assembly graph in GFA format (e.g.,
../02_pacbio-hifi/hifiasm_default/At_hifiasm_default.asm.bp.p_ctg.gfafor hifiasm, or../03_ont-assembly/flye_ont/assembly_graph.gfafor Flye). - Explore the graph structure, identify complex regions, and visualize connections between contigs or scaffolds.
Bandage input format
Bandage requires assembly graph files
(.gfa format), not FASTA files. HiFiasm outputs
.gfa files directly, while Flye produces
assembly_graph.gfa in its output directory.
Unified Assembly Comparison
After running all evaluation tools, compile your results into a summary table to compare assemblies side by side:
| Metric | HiFiasm (HiFi) | Flye (HiFi) | Flye (ONT) | HiFiasm (ONT) | Hybrid (Flye) | HiFiasm + Bionano | Flye + Bionano |
|---|---|---|---|---|---|---|---|
| # Contigs | 146 | 83 | 50 | 105 | 333 | 153 | 42 |
| Total size (Mb) | 135.75 | 133.68 | 128.74 | 127.42 | 121.11 | 143.79 | 128.97 |
| N50 (Mb) | 7.98 | 5.97 | 11.82 | 11.34 | 4.06 | 14.05 | 15.52 |
| L50 | 7 | 8 | 5 | 6 | 9 | 5 | 4 |
| BUSCO Complete (%) | 97.08 | 99.93 | 100.00 | 99.65 | 99.91 | 97.06 | 100.00 |
| BUSCO Single (%) | 95.97 | 98.89 | 98.93 | 98.61 | 98.50 | 95.97 | 98.93 |
| BUSCO Duplicated (%) | 1.11 | 1.04 | 1.07 | 1.04 | 1.41 | 1.09 | 1.07 |
| Genome fraction (%) | 86.68 | 90.47 | 99.43 | 95.58 | 90.76 | 86.71 | 99.41 |
| Misassemblies | 824 | 484 | 183 | 59 | 480 | 836 | 198 |
| Merqury QV | — | — | — | — | — | 62.91 | — |
| K-mer completeness (%) | — | — | — | — | — | 95.73 | — |
Interpreting your results
When comparing assemblies, consider these questions:
- Which assembly has the highest N50 and lowest number of contigs?
- Which assembly has the best BUSCO completeness?
- How do the Merqury QV scores compare? (Higher QV = fewer base-level errors)
- Did Bionano scaffolding improve contiguity (N50) compared to the unscaffolded assemblies?
- Is the total assembly size close to the expected genome size (~135 Mb for A. thaliana)?
Fill in the table above with your actual results and discuss which assembly strategy produced the best outcome for this dataset.
- QUAST evaluates assembly contiguity and quality metrics.
- Compleasm assesses gene-space completeness in genome assemblies.
- Merqury provides reference-free evaluation based on k-mer analysis.
- Bandage visualizes assembly graphs for structural assessment.